African vs Immigrants from Ghana Median Earnings
COMPARE
African
Immigrants from Ghana
Median Earnings
Median Earnings Comparison
Africans
Immigrants from Ghana
$41,955
MEDIAN EARNINGS
0.2/ 100
METRIC RATING
282nd/ 347
METRIC RANK
$45,641
MEDIAN EARNINGS
24.8/ 100
METRIC RATING
206th/ 347
METRIC RANK
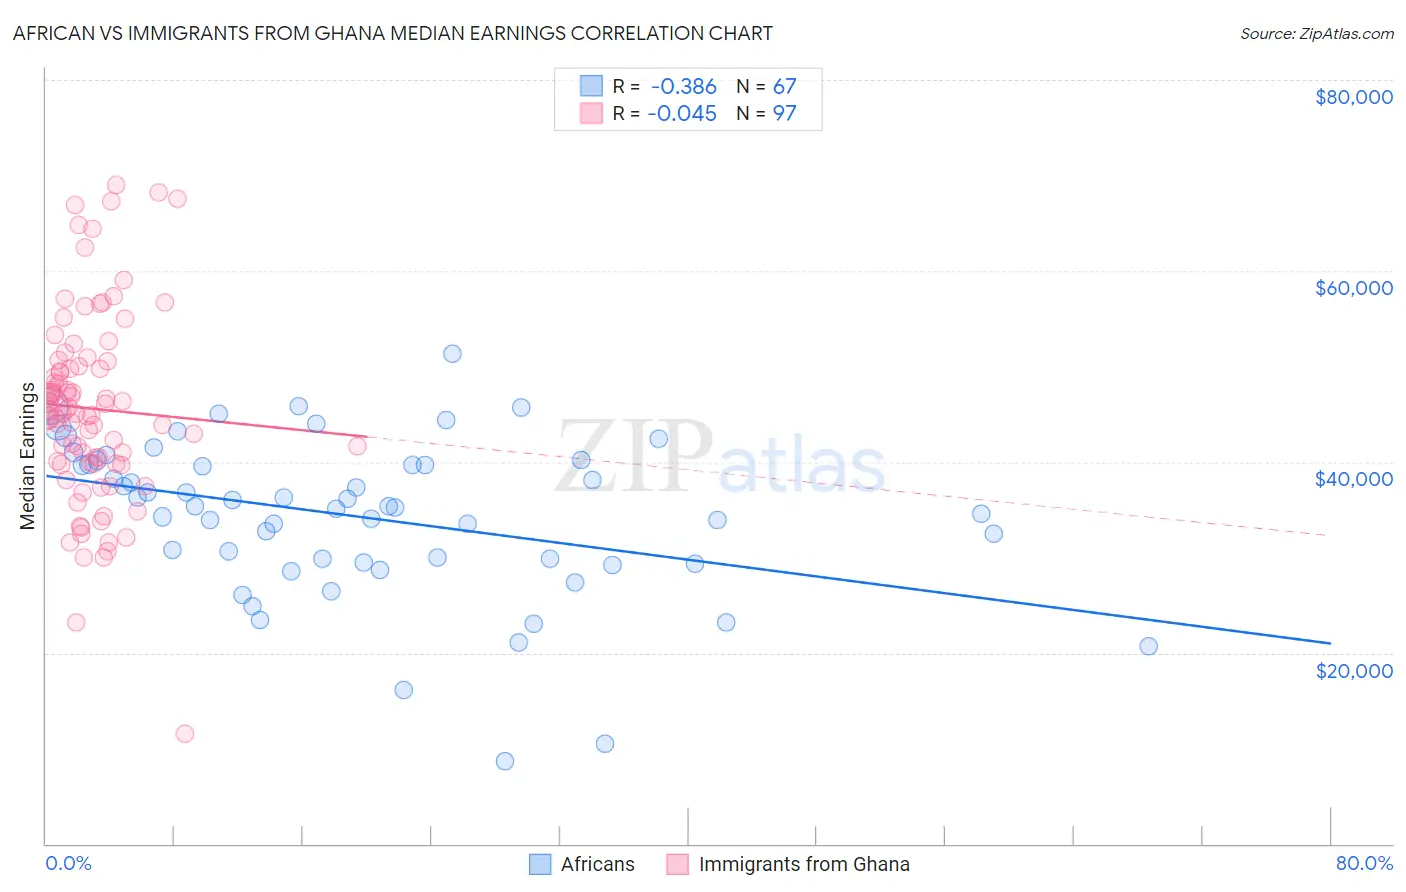
African vs Immigrants from Ghana Median Earnings Correlation Chart
The statistical analysis conducted on geographies consisting of 470,066,359 people shows a mild negative correlation between the proportion of Africans and median earnings in the United States with a correlation coefficient (R) of -0.386 and weighted average of $41,955. Similarly, the statistical analysis conducted on geographies consisting of 199,945,483 people shows no correlation between the proportion of Immigrants from Ghana and median earnings in the United States with a correlation coefficient (R) of -0.045 and weighted average of $45,641, a difference of 8.8%.
Median Earnings Correlation Summary
| Measurement | African | Immigrants from Ghana |
| Minimum | $8,672 | $11,479 |
| Maximum | $51,324 | $69,009 |
| Range | $42,652 | $57,530 |
| Mean | $34,249 | $45,584 |
| Median | $35,314 | $45,406 |
| Interquartile 25% (IQ1) | $29,519 | $39,912 |
| Interquartile 75% (IQ3) | $39,743 | $50,257 |
| Interquartile Range (IQR) | $10,224 | $10,345 |
| Standard Deviation (Sample) | $8,278 | $10,012 |
| Standard Deviation (Population) | $8,216 | $9,960 |
Similar Demographics by Median Earnings
Demographics Similar to Africans by Median Earnings
In terms of median earnings, the demographic groups most similar to Africans are Marshallese ($41,969, a difference of 0.030%), Dominican ($41,864, a difference of 0.22%), Blackfeet ($41,822, a difference of 0.32%), Hmong ($42,111, a difference of 0.37%), and Colville ($42,151, a difference of 0.47%).
| Demographics | Rating | Rank | Median Earnings |
| Immigrants | Belize | 0.3 /100 | #275 | Tragic $42,339 |
| Spanish Americans | 0.3 /100 | #276 | Tragic $42,316 |
| Central Americans | 0.3 /100 | #277 | Tragic $42,280 |
| Cajuns | 0.3 /100 | #278 | Tragic $42,189 |
| Colville | 0.2 /100 | #279 | Tragic $42,151 |
| Hmong | 0.2 /100 | #280 | Tragic $42,111 |
| Marshallese | 0.2 /100 | #281 | Tragic $41,969 |
| Africans | 0.2 /100 | #282 | Tragic $41,955 |
| Dominicans | 0.2 /100 | #283 | Tragic $41,864 |
| Blackfeet | 0.2 /100 | #284 | Tragic $41,822 |
| Immigrants | Nicaragua | 0.1 /100 | #285 | Tragic $41,737 |
| Mexican American Indians | 0.1 /100 | #286 | Tragic $41,719 |
| Indonesians | 0.1 /100 | #287 | Tragic $41,701 |
| Immigrants | Dominican Republic | 0.1 /100 | #288 | Tragic $41,554 |
| Comanche | 0.1 /100 | #289 | Tragic $41,519 |
Demographics Similar to Immigrants from Ghana by Median Earnings
In terms of median earnings, the demographic groups most similar to Immigrants from Ghana are Tongan ($45,665, a difference of 0.050%), Immigrants from Senegal ($45,611, a difference of 0.070%), Immigrants from Uruguay ($45,682, a difference of 0.090%), Immigrants from Bosnia and Herzegovina ($45,600, a difference of 0.090%), and Immigrants from Thailand ($45,598, a difference of 0.10%).
| Demographics | Rating | Rank | Median Earnings |
| Immigrants | Barbados | 29.6 /100 | #199 | Fair $45,816 |
| Immigrants | Azores | 29.5 /100 | #200 | Fair $45,812 |
| Celtics | 27.2 /100 | #201 | Fair $45,732 |
| Immigrants | Trinidad and Tobago | 27.1 /100 | #202 | Fair $45,729 |
| Welsh | 26.6 /100 | #203 | Fair $45,710 |
| Immigrants | Uruguay | 25.9 /100 | #204 | Fair $45,682 |
| Tongans | 25.4 /100 | #205 | Fair $45,665 |
| Immigrants | Ghana | 24.8 /100 | #206 | Fair $45,641 |
| Immigrants | Senegal | 24.0 /100 | #207 | Fair $45,611 |
| Immigrants | Bosnia and Herzegovina | 23.7 /100 | #208 | Fair $45,600 |
| Immigrants | Thailand | 23.7 /100 | #209 | Fair $45,598 |
| Immigrants | Grenada | 23.6 /100 | #210 | Fair $45,596 |
| Panamanians | 23.5 /100 | #211 | Fair $45,593 |
| Bermudans | 23.5 /100 | #212 | Fair $45,593 |
| Immigrants | Colombia | 22.4 /100 | #213 | Fair $45,550 |