African vs Bahamian Median Earnings
COMPARE
African
Bahamian
Median Earnings
Median Earnings Comparison
Africans
Bahamians
$41,955
MEDIAN EARNINGS
0.2/ 100
METRIC RATING
282nd/ 347
METRIC RANK
$39,735
MEDIAN EARNINGS
0.0/ 100
METRIC RATING
323rd/ 347
METRIC RANK
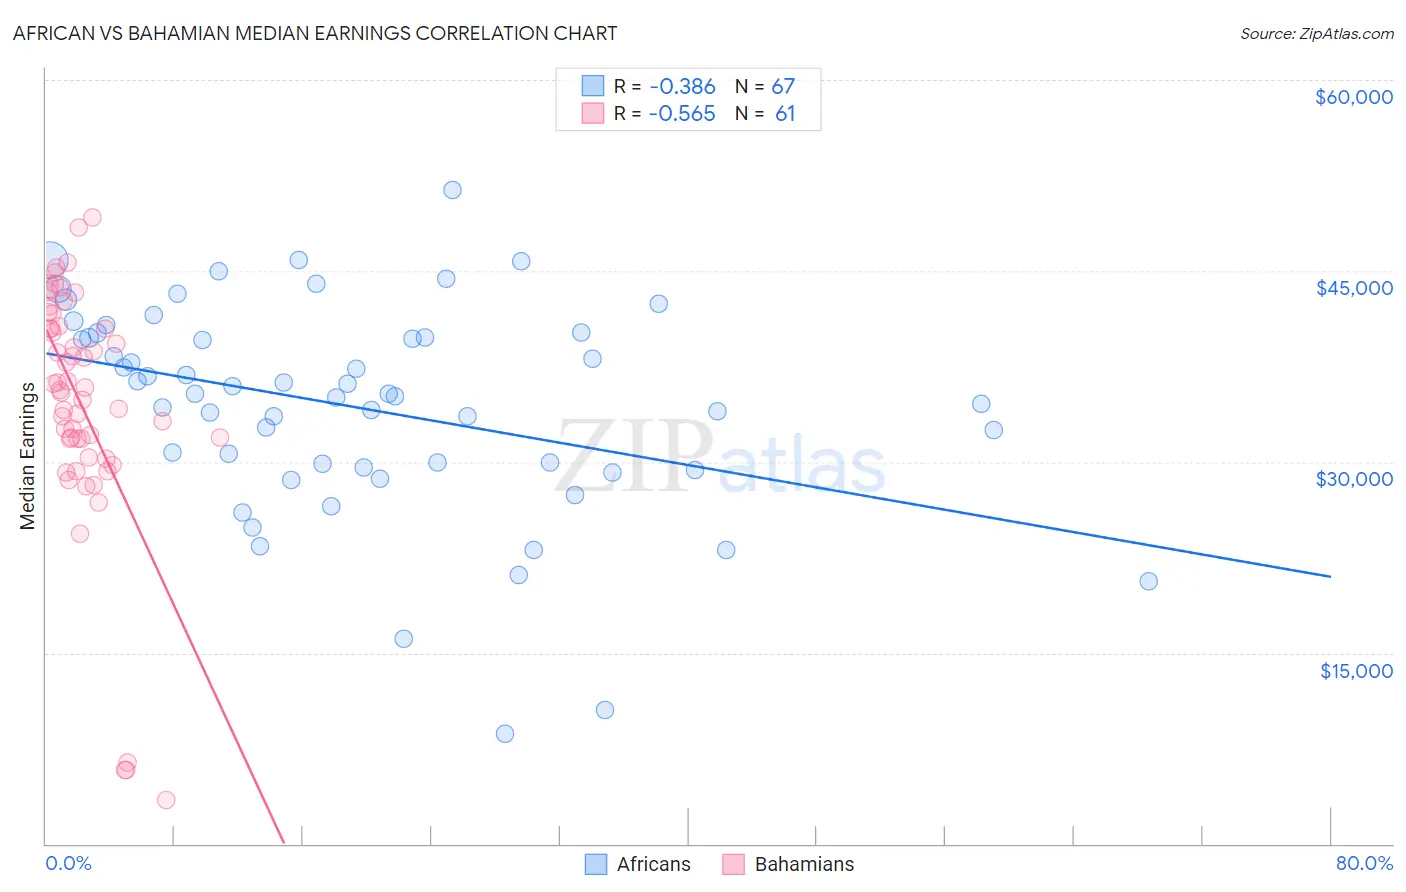
African vs Bahamian Median Earnings Correlation Chart
The statistical analysis conducted on geographies consisting of 470,066,359 people shows a mild negative correlation between the proportion of Africans and median earnings in the United States with a correlation coefficient (R) of -0.386 and weighted average of $41,955. Similarly, the statistical analysis conducted on geographies consisting of 112,703,764 people shows a substantial negative correlation between the proportion of Bahamians and median earnings in the United States with a correlation coefficient (R) of -0.565 and weighted average of $39,735, a difference of 5.6%.
Median Earnings Correlation Summary
| Measurement | African | Bahamian |
| Minimum | $8,672 | $3,467 |
| Maximum | $51,324 | $49,150 |
| Range | $42,652 | $45,683 |
| Mean | $34,249 | $34,478 |
| Median | $35,314 | $35,694 |
| Interquartile 25% (IQ1) | $29,519 | $31,085 |
| Interquartile 75% (IQ3) | $39,743 | $40,552 |
| Interquartile Range (IQR) | $10,224 | $9,467 |
| Standard Deviation (Sample) | $8,278 | $9,647 |
| Standard Deviation (Population) | $8,216 | $9,567 |
Similar Demographics by Median Earnings
Demographics Similar to Africans by Median Earnings
In terms of median earnings, the demographic groups most similar to Africans are Marshallese ($41,969, a difference of 0.030%), Dominican ($41,864, a difference of 0.22%), Blackfeet ($41,822, a difference of 0.32%), Hmong ($42,111, a difference of 0.37%), and Colville ($42,151, a difference of 0.47%).
| Demographics | Rating | Rank | Median Earnings |
| Immigrants | Belize | 0.3 /100 | #275 | Tragic $42,339 |
| Spanish Americans | 0.3 /100 | #276 | Tragic $42,316 |
| Central Americans | 0.3 /100 | #277 | Tragic $42,280 |
| Cajuns | 0.3 /100 | #278 | Tragic $42,189 |
| Colville | 0.2 /100 | #279 | Tragic $42,151 |
| Hmong | 0.2 /100 | #280 | Tragic $42,111 |
| Marshallese | 0.2 /100 | #281 | Tragic $41,969 |
| Africans | 0.2 /100 | #282 | Tragic $41,955 |
| Dominicans | 0.2 /100 | #283 | Tragic $41,864 |
| Blackfeet | 0.2 /100 | #284 | Tragic $41,822 |
| Immigrants | Nicaragua | 0.1 /100 | #285 | Tragic $41,737 |
| Mexican American Indians | 0.1 /100 | #286 | Tragic $41,719 |
| Indonesians | 0.1 /100 | #287 | Tragic $41,701 |
| Immigrants | Dominican Republic | 0.1 /100 | #288 | Tragic $41,554 |
| Comanche | 0.1 /100 | #289 | Tragic $41,519 |
Demographics Similar to Bahamians by Median Earnings
In terms of median earnings, the demographic groups most similar to Bahamians are Ottawa ($39,721, a difference of 0.040%), Immigrants from Central America ($39,762, a difference of 0.070%), Creek ($39,648, a difference of 0.22%), Mexican ($39,834, a difference of 0.25%), and Immigrants from Bahamas ($39,861, a difference of 0.32%).
| Demographics | Rating | Rank | Median Earnings |
| Immigrants | Honduras | 0.0 /100 | #316 | Tragic $40,195 |
| Fijians | 0.0 /100 | #317 | Tragic $40,193 |
| Dutch West Indians | 0.0 /100 | #318 | Tragic $40,107 |
| Blacks/African Americans | 0.0 /100 | #319 | Tragic $40,085 |
| Immigrants | Bahamas | 0.0 /100 | #320 | Tragic $39,861 |
| Mexicans | 0.0 /100 | #321 | Tragic $39,834 |
| Immigrants | Central America | 0.0 /100 | #322 | Tragic $39,762 |
| Bahamians | 0.0 /100 | #323 | Tragic $39,735 |
| Ottawa | 0.0 /100 | #324 | Tragic $39,721 |
| Creek | 0.0 /100 | #325 | Tragic $39,648 |
| Immigrants | Yemen | 0.0 /100 | #326 | Tragic $39,540 |
| Yuman | 0.0 /100 | #327 | Tragic $39,523 |
| Sioux | 0.0 /100 | #328 | Tragic $39,448 |
| Kiowa | 0.0 /100 | #329 | Tragic $39,232 |
| Immigrants | Congo | 0.0 /100 | #330 | Tragic $39,169 |