Immigrants from India vs Immigrants from Ukraine Median Family Income
COMPARE
Immigrants from India
Immigrants from Ukraine
Median Family Income
Median Family Income Comparison
Immigrants from India
Immigrants from Ukraine
$134,028
MEDIAN FAMILY INCOME
100.0/ 100
METRIC RATING
4th/ 347
METRIC RANK
$109,645
MEDIAN FAMILY INCOME
97.2/ 100
METRIC RATING
101st/ 347
METRIC RANK
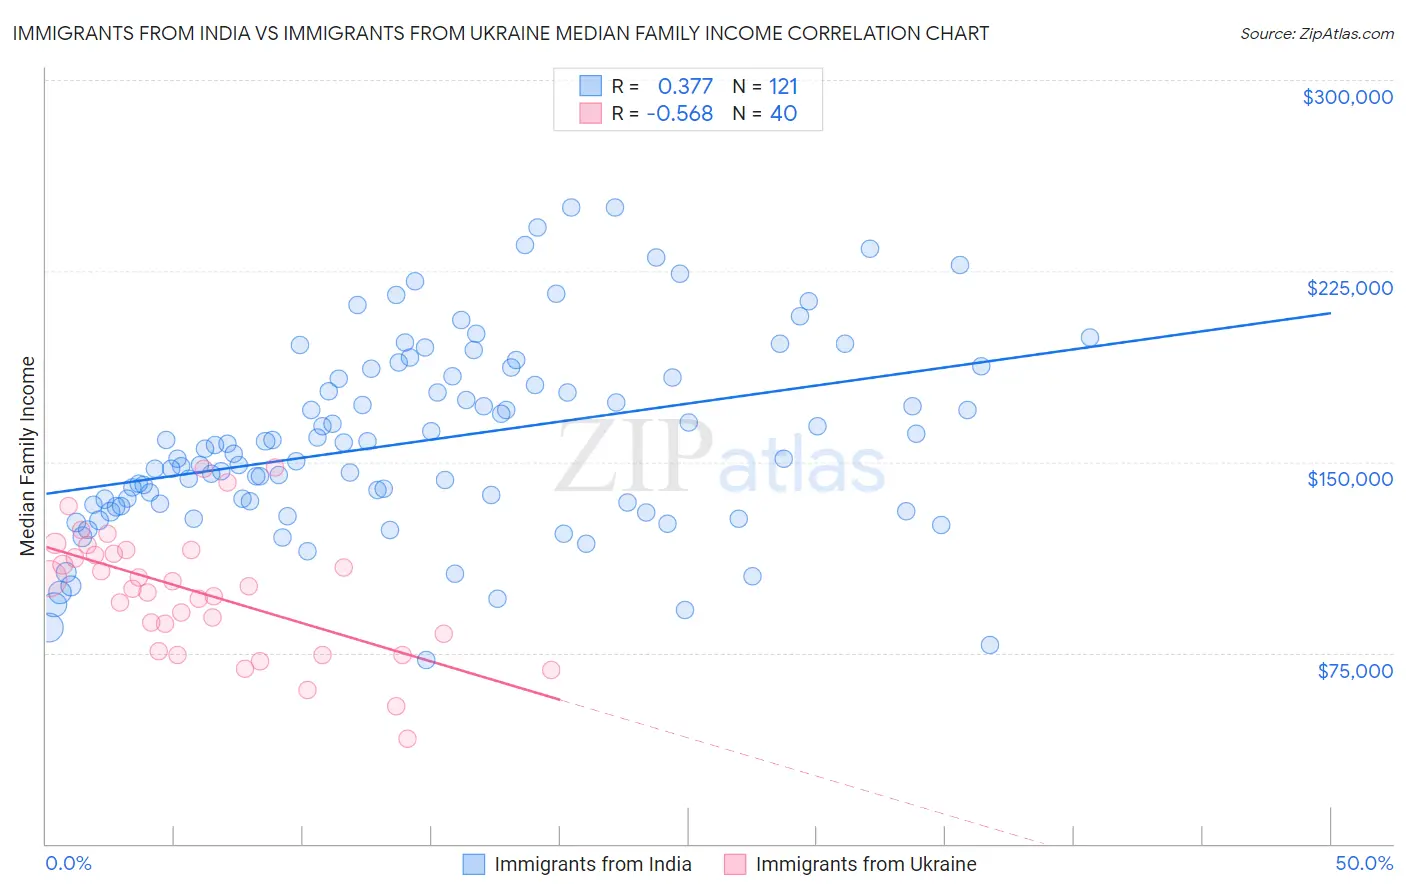
Immigrants from India vs Immigrants from Ukraine Median Family Income Correlation Chart
The statistical analysis conducted on geographies consisting of 433,562,423 people shows a mild positive correlation between the proportion of Immigrants from India and median family income in the United States with a correlation coefficient (R) of 0.377 and weighted average of $134,028. Similarly, the statistical analysis conducted on geographies consisting of 289,573,478 people shows a substantial negative correlation between the proportion of Immigrants from Ukraine and median family income in the United States with a correlation coefficient (R) of -0.568 and weighted average of $109,645, a difference of 22.2%.
Median Family Income Correlation Summary
| Measurement | Immigrants from India | Immigrants from Ukraine |
| Minimum | $71,983 | $41,250 |
| Maximum | $250,001 | $147,711 |
| Range | $178,018 | $106,461 |
| Mean | $158,155 | $98,572 |
| Median | $153,095 | $100,738 |
| Interquartile 25% (IQ1) | $132,876 | $79,127 |
| Interquartile 75% (IQ3) | $183,418 | $114,676 |
| Interquartile Range (IQR) | $50,542 | $35,549 |
| Standard Deviation (Sample) | $37,573 | $24,600 |
| Standard Deviation (Population) | $37,418 | $24,291 |
Similar Demographics by Median Family Income
Demographics Similar to Immigrants from India by Median Family Income
In terms of median family income, the demographic groups most similar to Immigrants from India are Iranian ($133,839, a difference of 0.14%), Immigrants from Singapore ($134,818, a difference of 0.59%), Thai ($131,281, a difference of 2.1%), Immigrants from Taiwan ($136,949, a difference of 2.2%), and Immigrants from Hong Kong ($131,067, a difference of 2.3%).
| Demographics | Rating | Rank | Median Family Income |
| Filipinos | 100.0 /100 | #1 | Exceptional $138,397 |
| Immigrants | Taiwan | 100.0 /100 | #2 | Exceptional $136,949 |
| Immigrants | Singapore | 100.0 /100 | #3 | Exceptional $134,818 |
| Immigrants | India | 100.0 /100 | #4 | Exceptional $134,028 |
| Iranians | 100.0 /100 | #5 | Exceptional $133,839 |
| Thais | 100.0 /100 | #6 | Exceptional $131,281 |
| Immigrants | Hong Kong | 100.0 /100 | #7 | Exceptional $131,067 |
| Immigrants | Iran | 100.0 /100 | #8 | Exceptional $130,894 |
| Okinawans | 100.0 /100 | #9 | Exceptional $129,979 |
| Immigrants | Ireland | 100.0 /100 | #10 | Exceptional $127,584 |
| Immigrants | Israel | 100.0 /100 | #11 | Exceptional $127,430 |
| Cypriots | 100.0 /100 | #12 | Exceptional $127,064 |
| Immigrants | Australia | 100.0 /100 | #13 | Exceptional $126,620 |
| Immigrants | South Central Asia | 100.0 /100 | #14 | Exceptional $125,956 |
| Eastern Europeans | 100.0 /100 | #15 | Exceptional $125,546 |
Demographics Similar to Immigrants from Ukraine by Median Family Income
In terms of median family income, the demographic groups most similar to Immigrants from Ukraine are Macedonian ($109,668, a difference of 0.020%), Assyrian/Chaldean/Syriac ($109,622, a difference of 0.020%), Armenian ($109,692, a difference of 0.040%), Immigrants from Kuwait ($109,731, a difference of 0.080%), and Jordanian ($109,865, a difference of 0.20%).
| Demographics | Rating | Rank | Median Family Income |
| Koreans | 97.8 /100 | #94 | Exceptional $110,103 |
| Zimbabweans | 97.7 /100 | #95 | Exceptional $110,011 |
| Immigrants | Moldova | 97.7 /100 | #96 | Exceptional $109,975 |
| Jordanians | 97.5 /100 | #97 | Exceptional $109,865 |
| Immigrants | Kuwait | 97.4 /100 | #98 | Exceptional $109,731 |
| Armenians | 97.3 /100 | #99 | Exceptional $109,692 |
| Macedonians | 97.3 /100 | #100 | Exceptional $109,668 |
| Immigrants | Ukraine | 97.2 /100 | #101 | Exceptional $109,645 |
| Assyrians/Chaldeans/Syriacs | 97.2 /100 | #102 | Exceptional $109,622 |
| Immigrants | Brazil | 96.9 /100 | #103 | Exceptional $109,418 |
| Palestinians | 96.9 /100 | #104 | Exceptional $109,413 |
| Syrians | 96.7 /100 | #105 | Exceptional $109,299 |
| Albanians | 96.4 /100 | #106 | Exceptional $109,136 |
| Immigrants | North Macedonia | 96.4 /100 | #107 | Exceptional $109,136 |
| Immigrants | Zimbabwe | 95.9 /100 | #108 | Exceptional $108,830 |