Indonesian vs Immigrants from Ukraine Median Family Income
COMPARE
Indonesian
Immigrants from Ukraine
Median Family Income
Median Family Income Comparison
Indonesians
Immigrants from Ukraine
$88,301
MEDIAN FAMILY INCOME
0.1/ 100
METRIC RATING
284th/ 347
METRIC RANK
$109,645
MEDIAN FAMILY INCOME
97.2/ 100
METRIC RATING
101st/ 347
METRIC RANK
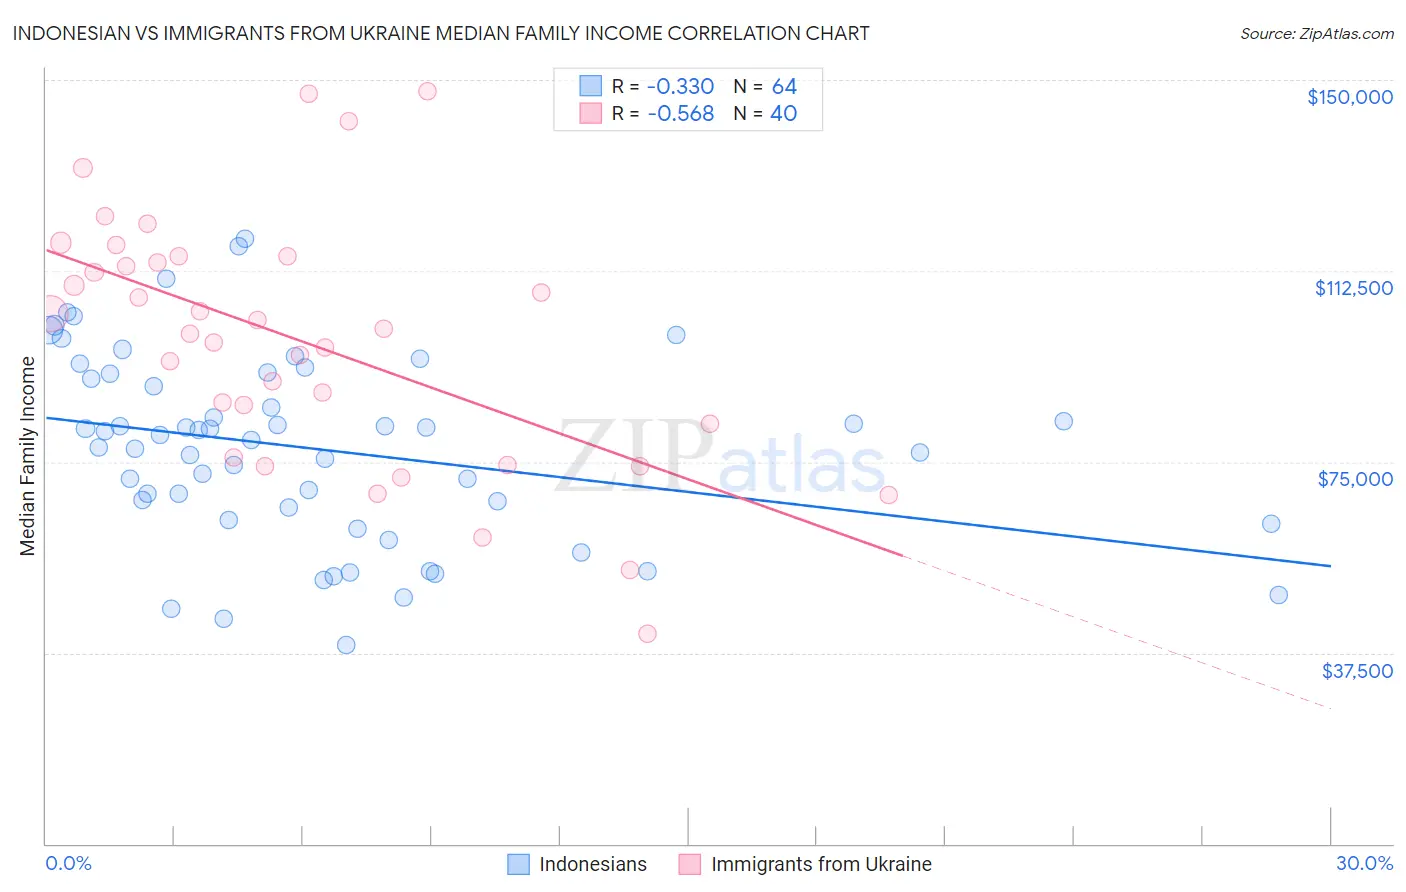
Indonesian vs Immigrants from Ukraine Median Family Income Correlation Chart
The statistical analysis conducted on geographies consisting of 162,594,892 people shows a mild negative correlation between the proportion of Indonesians and median family income in the United States with a correlation coefficient (R) of -0.330 and weighted average of $88,301. Similarly, the statistical analysis conducted on geographies consisting of 289,573,478 people shows a substantial negative correlation between the proportion of Immigrants from Ukraine and median family income in the United States with a correlation coefficient (R) of -0.568 and weighted average of $109,645, a difference of 24.2%.
Median Family Income Correlation Summary
| Measurement | Indonesian | Immigrants from Ukraine |
| Minimum | $39,136 | $41,250 |
| Maximum | $118,875 | $147,711 |
| Range | $79,739 | $106,461 |
| Mean | $77,501 | $98,572 |
| Median | $79,746 | $100,738 |
| Interquartile 25% (IQ1) | $64,843 | $79,127 |
| Interquartile 75% (IQ3) | $91,846 | $114,676 |
| Interquartile Range (IQR) | $27,003 | $35,549 |
| Standard Deviation (Sample) | $18,499 | $24,600 |
| Standard Deviation (Population) | $18,353 | $24,291 |
Similar Demographics by Median Family Income
Demographics Similar to Indonesians by Median Family Income
In terms of median family income, the demographic groups most similar to Indonesians are Guatemalan ($88,295, a difference of 0.010%), Immigrants from Nicaragua ($88,267, a difference of 0.040%), Potawatomi ($88,265, a difference of 0.040%), Bangladeshi ($88,358, a difference of 0.060%), and Cherokee ($88,209, a difference of 0.10%).
| Demographics | Rating | Rank | Median Family Income |
| Immigrants | Jamaica | 0.1 /100 | #277 | Tragic $89,268 |
| Immigrants | Grenada | 0.1 /100 | #278 | Tragic $89,249 |
| Immigrants | Belize | 0.1 /100 | #279 | Tragic $89,197 |
| British West Indians | 0.1 /100 | #280 | Tragic $88,987 |
| Blackfeet | 0.1 /100 | #281 | Tragic $88,717 |
| Comanche | 0.1 /100 | #282 | Tragic $88,556 |
| Bangladeshis | 0.1 /100 | #283 | Tragic $88,358 |
| Indonesians | 0.1 /100 | #284 | Tragic $88,301 |
| Guatemalans | 0.1 /100 | #285 | Tragic $88,295 |
| Immigrants | Nicaragua | 0.1 /100 | #286 | Tragic $88,267 |
| Potawatomi | 0.1 /100 | #287 | Tragic $88,265 |
| Cherokee | 0.1 /100 | #288 | Tragic $88,209 |
| Central American Indians | 0.1 /100 | #289 | Tragic $88,034 |
| Shoshone | 0.1 /100 | #290 | Tragic $87,872 |
| Immigrants | Cabo Verde | 0.1 /100 | #291 | Tragic $87,830 |
Demographics Similar to Immigrants from Ukraine by Median Family Income
In terms of median family income, the demographic groups most similar to Immigrants from Ukraine are Macedonian ($109,668, a difference of 0.020%), Assyrian/Chaldean/Syriac ($109,622, a difference of 0.020%), Armenian ($109,692, a difference of 0.040%), Immigrants from Kuwait ($109,731, a difference of 0.080%), and Jordanian ($109,865, a difference of 0.20%).
| Demographics | Rating | Rank | Median Family Income |
| Koreans | 97.8 /100 | #94 | Exceptional $110,103 |
| Zimbabweans | 97.7 /100 | #95 | Exceptional $110,011 |
| Immigrants | Moldova | 97.7 /100 | #96 | Exceptional $109,975 |
| Jordanians | 97.5 /100 | #97 | Exceptional $109,865 |
| Immigrants | Kuwait | 97.4 /100 | #98 | Exceptional $109,731 |
| Armenians | 97.3 /100 | #99 | Exceptional $109,692 |
| Macedonians | 97.3 /100 | #100 | Exceptional $109,668 |
| Immigrants | Ukraine | 97.2 /100 | #101 | Exceptional $109,645 |
| Assyrians/Chaldeans/Syriacs | 97.2 /100 | #102 | Exceptional $109,622 |
| Immigrants | Brazil | 96.9 /100 | #103 | Exceptional $109,418 |
| Palestinians | 96.9 /100 | #104 | Exceptional $109,413 |
| Syrians | 96.7 /100 | #105 | Exceptional $109,299 |
| Albanians | 96.4 /100 | #106 | Exceptional $109,136 |
| Immigrants | North Macedonia | 96.4 /100 | #107 | Exceptional $109,136 |
| Immigrants | Zimbabwe | 95.9 /100 | #108 | Exceptional $108,830 |