Afghan vs Immigrants from Canada Hearing Disability
COMPARE
Afghan
Immigrants from Canada
Hearing Disability
Hearing Disability Comparison
Afghans
Immigrants from Canada
2.7%
HEARING DISABILITY
97.6/ 100
METRIC RATING
72nd/ 347
METRIC RANK
3.5%
HEARING DISABILITY
0.1/ 100
METRIC RATING
263rd/ 347
METRIC RANK
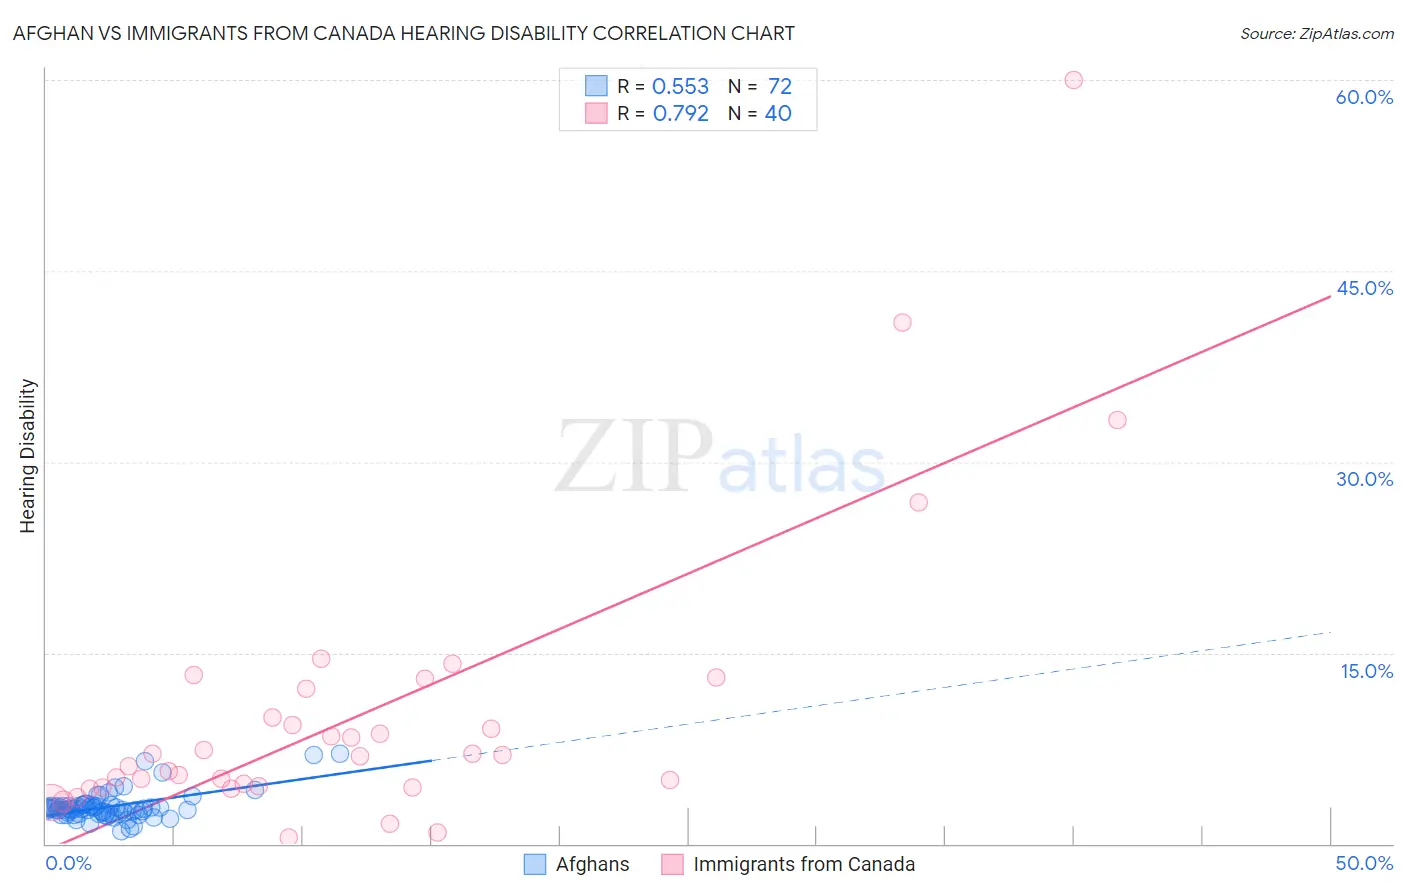
Afghan vs Immigrants from Canada Hearing Disability Correlation Chart
The statistical analysis conducted on geographies consisting of 148,839,750 people shows a substantial positive correlation between the proportion of Afghans and percentage of population with hearing disability in the United States with a correlation coefficient (R) of 0.553 and weighted average of 2.7%. Similarly, the statistical analysis conducted on geographies consisting of 459,215,388 people shows a strong positive correlation between the proportion of Immigrants from Canada and percentage of population with hearing disability in the United States with a correlation coefficient (R) of 0.792 and weighted average of 3.5%, a difference of 26.8%.
Hearing Disability Correlation Summary
| Measurement | Afghan | Immigrants from Canada |
| Minimum | 0.95% | 0.49% |
| Maximum | 7.1% | 60.0% |
| Range | 6.1% | 59.5% |
| Mean | 2.9% | 10.2% |
| Median | 2.7% | 7.0% |
| Interquartile 25% (IQ1) | 2.4% | 4.5% |
| Interquartile 75% (IQ3) | 3.0% | 11.0% |
| Interquartile Range (IQR) | 0.55% | 6.6% |
| Standard Deviation (Sample) | 1.1% | 11.5% |
| Standard Deviation (Population) | 1.1% | 11.3% |
Similar Demographics by Hearing Disability
Demographics Similar to Afghans by Hearing Disability
In terms of hearing disability, the demographic groups most similar to Afghans are Argentinean (2.7%, a difference of 0.080%), Immigrants from Korea (2.7%, a difference of 0.080%), Central American (2.7%, a difference of 0.10%), Immigrants from Saudi Arabia (2.7%, a difference of 0.11%), and Asian (2.7%, a difference of 0.11%).
| Demographics | Rating | Rank | Hearing Disability |
| Immigrants | Nepal | 98.3 /100 | #65 | Exceptional 2.7% |
| Immigrants | Belize | 98.2 /100 | #66 | Exceptional 2.7% |
| Egyptians | 98.1 /100 | #67 | Exceptional 2.7% |
| Immigrants | Africa | 98.0 /100 | #68 | Exceptional 2.7% |
| Nicaraguans | 97.9 /100 | #69 | Exceptional 2.7% |
| Peruvians | 97.7 /100 | #70 | Exceptional 2.7% |
| Central Americans | 97.7 /100 | #71 | Exceptional 2.7% |
| Afghans | 97.6 /100 | #72 | Exceptional 2.7% |
| Argentineans | 97.5 /100 | #73 | Exceptional 2.7% |
| Immigrants | Korea | 97.5 /100 | #74 | Exceptional 2.7% |
| Immigrants | Saudi Arabia | 97.5 /100 | #75 | Exceptional 2.7% |
| Asians | 97.5 /100 | #76 | Exceptional 2.7% |
| Immigrants | Malaysia | 97.5 /100 | #77 | Exceptional 2.7% |
| Mongolians | 97.4 /100 | #78 | Exceptional 2.7% |
| Colombians | 97.4 /100 | #79 | Exceptional 2.7% |
Demographics Similar to Immigrants from Canada by Hearing Disability
In terms of hearing disability, the demographic groups most similar to Immigrants from Canada are Immigrants from North America (3.5%, a difference of 0.040%), Hawaiian (3.5%, a difference of 0.16%), Portuguese (3.5%, a difference of 0.19%), Immigrants from Germany (3.5%, a difference of 0.22%), and British (3.5%, a difference of 0.24%).
| Demographics | Rating | Rank | Hearing Disability |
| Hmong | 0.2 /100 | #256 | Tragic 3.4% |
| Yaqui | 0.2 /100 | #257 | Tragic 3.4% |
| Northern Europeans | 0.2 /100 | #258 | Tragic 3.4% |
| Slovenes | 0.1 /100 | #259 | Tragic 3.5% |
| Portuguese | 0.1 /100 | #260 | Tragic 3.5% |
| Hawaiians | 0.1 /100 | #261 | Tragic 3.5% |
| Immigrants | North America | 0.1 /100 | #262 | Tragic 3.5% |
| Immigrants | Canada | 0.1 /100 | #263 | Tragic 3.5% |
| Immigrants | Germany | 0.1 /100 | #264 | Tragic 3.5% |
| British | 0.1 /100 | #265 | Tragic 3.5% |
| Belgians | 0.1 /100 | #266 | Tragic 3.5% |
| Canadians | 0.1 /100 | #267 | Tragic 3.5% |
| Spaniards | 0.1 /100 | #268 | Tragic 3.5% |
| Ute | 0.1 /100 | #269 | Tragic 3.5% |
| Europeans | 0.1 /100 | #270 | Tragic 3.5% |