Zip Codes with the Highest Percentage of Population Employed in Accommodation & Food Services in Tifton, GA
RELATED REPORTS & OPTIONS
Accommodation & Food Services
Tifton
Compare Zip Codes
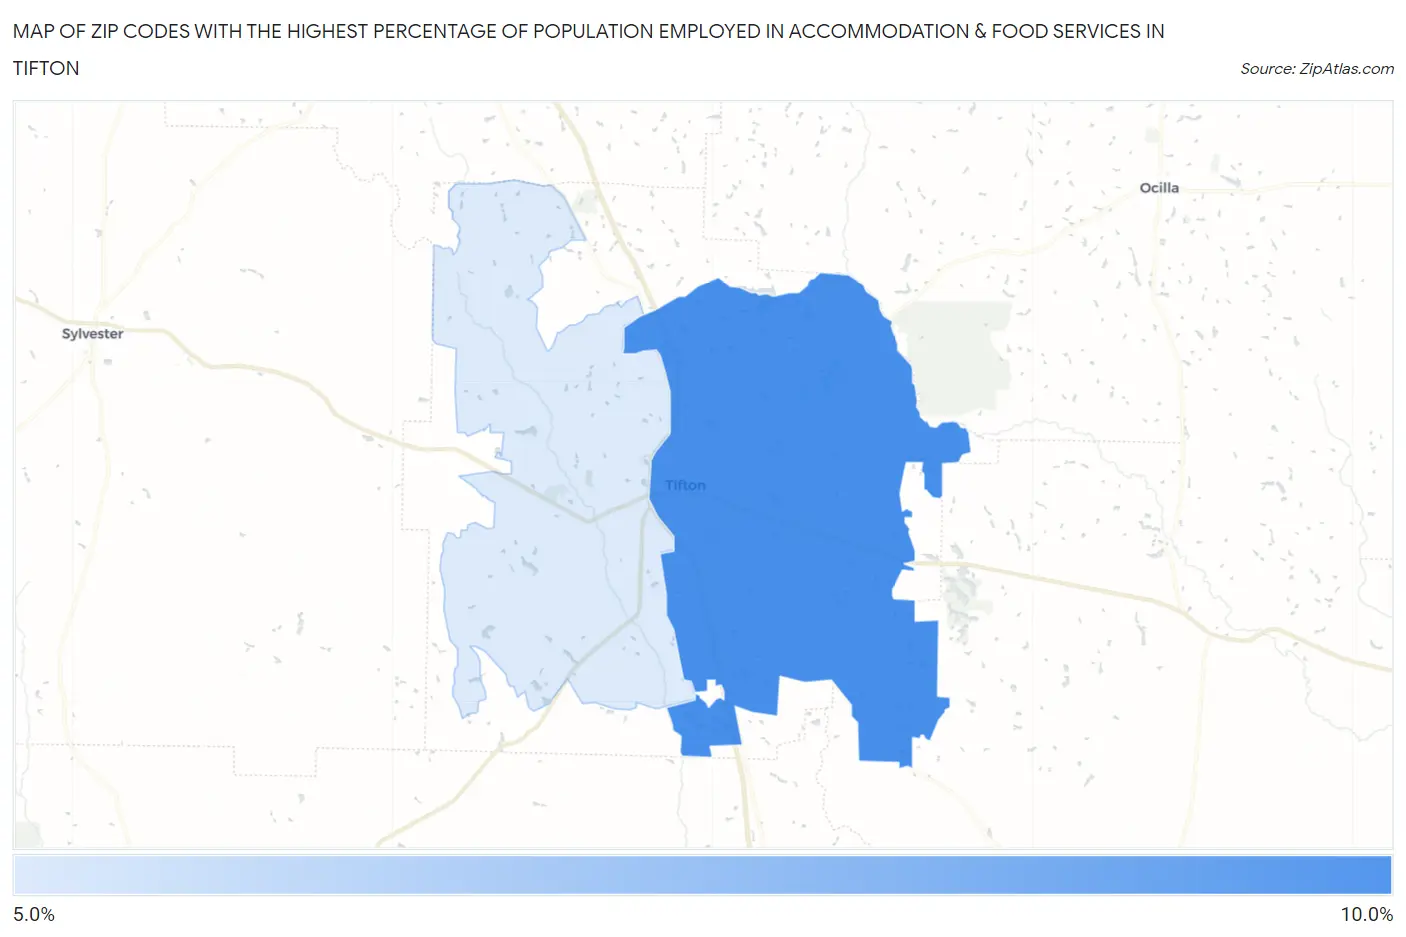
Map of Zip Codes with the Highest Percentage of Population Employed in Accommodation & Food Services in Tifton
5.2%
9.2%
Zip Codes with the Highest Percentage of Population Employed in Accommodation & Food Services in Tifton, GA
| Zip Code | % Employed | vs State | vs National | |
| 1. | 31794 | 9.2% | 7.2%(+2.00)#136 | 6.9%(+2.33)#5,643 |
| 2. | 31793 | 5.2% | 7.2%(-1.99)#418 | 6.9%(-1.67)#16,060 |
1
Common Questions
What are the Top Zip Codes with the Highest Percentage of Population Employed in Accommodation & Food Services in Tifton, GA?
Top Zip Codes with the Highest Percentage of Population Employed in Accommodation & Food Services in Tifton, GA are:
What zip code has the Highest Percentage of Population Employed in Accommodation & Food Services in Tifton, GA?
31794 has the Highest Percentage of Population Employed in Accommodation & Food Services in Tifton, GA with 9.2%.
What is the Percentage of Population Employed in Accommodation & Food Services in Tifton, GA?
Percentage of Population Employed in Accommodation & Food Services in Tifton is 9.2%.
What is the Percentage of Population Employed in Accommodation & Food Services in Georgia?
Percentage of Population Employed in Accommodation & Food Services in Georgia is 7.2%.
What is the Percentage of Population Employed in Accommodation & Food Services in the United States?
Percentage of Population Employed in Accommodation & Food Services in the United States is 6.9%.