White/Caucasian vs Serbian In Labor Force | Age 30-34
COMPARE
White/Caucasian
Serbian
In Labor Force | Age 30-34
In Labor Force | Age 30-34 Comparison
Whites/Caucasians
Serbians
83.9%
IN LABOR FORCE | AGE 30-34
0.5/ 100
METRIC RATING
255th/ 347
METRIC RANK
85.8%
IN LABOR FORCE | AGE 30-34
99.9/ 100
METRIC RATING
35th/ 347
METRIC RANK
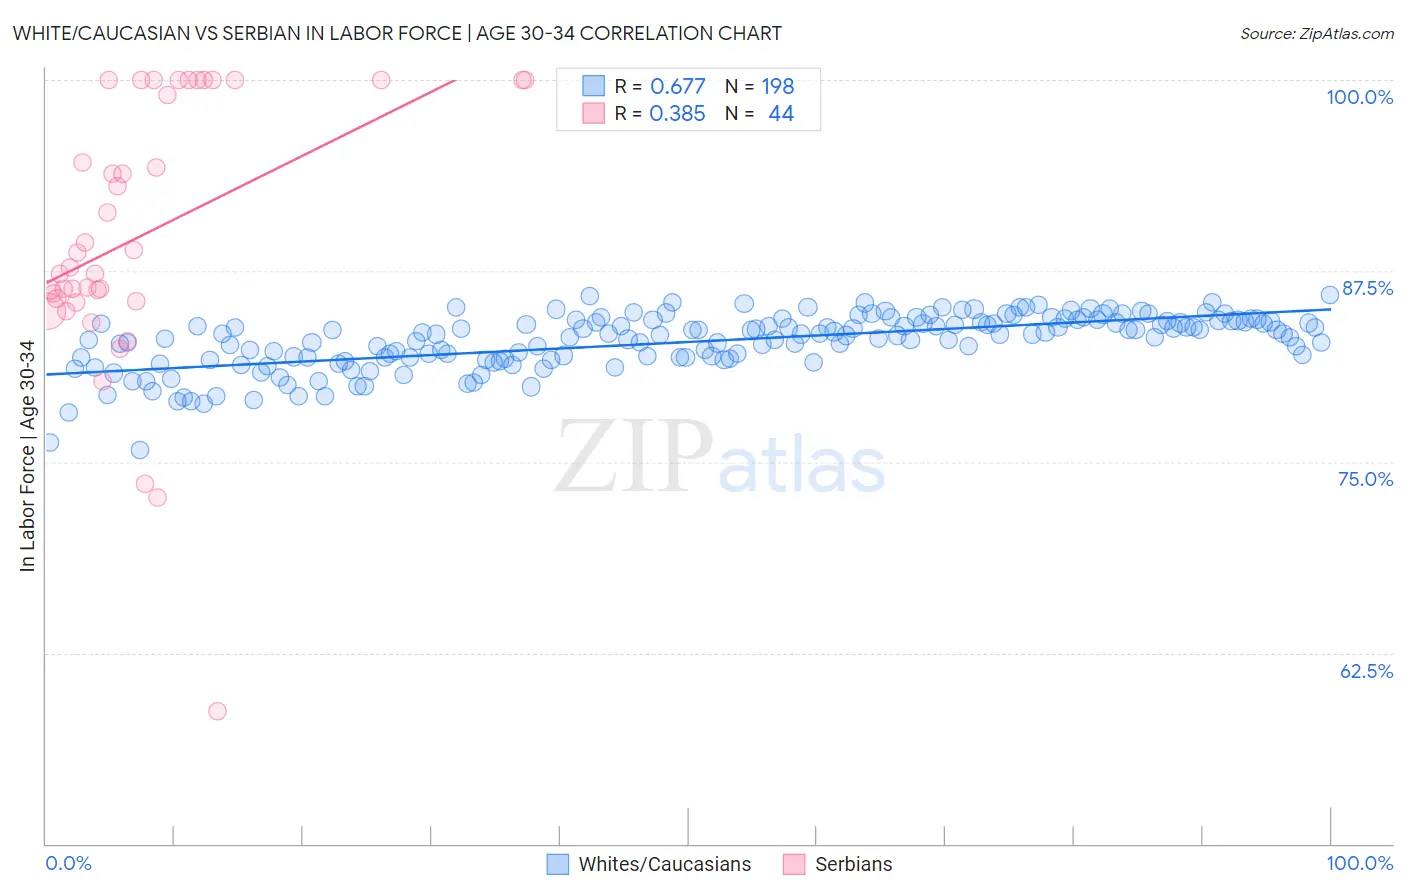
White/Caucasian vs Serbian In Labor Force | Age 30-34 Correlation Chart
The statistical analysis conducted on geographies consisting of 582,394,774 people shows a significant positive correlation between the proportion of Whites/Caucasians and labor force participation rate among population between the ages 30 and 34 in the United States with a correlation coefficient (R) of 0.677 and weighted average of 83.9%. Similarly, the statistical analysis conducted on geographies consisting of 267,513,994 people shows a mild positive correlation between the proportion of Serbians and labor force participation rate among population between the ages 30 and 34 in the United States with a correlation coefficient (R) of 0.385 and weighted average of 85.8%, a difference of 2.2%.
In Labor Force | Age 30-34 Correlation Summary
| Measurement | White/Caucasian | Serbian |
| Minimum | 75.8% | 58.7% |
| Maximum | 85.9% | 100.0% |
| Range | 10.2% | 41.3% |
| Mean | 82.9% | 89.9% |
| Median | 83.4% | 88.2% |
| Interquartile 25% (IQ1) | 81.8% | 85.6% |
| Interquartile 75% (IQ3) | 84.2% | 100.0% |
| Interquartile Range (IQR) | 2.4% | 14.4% |
| Standard Deviation (Sample) | 1.8% | 8.9% |
| Standard Deviation (Population) | 1.8% | 8.8% |
Similar Demographics by In Labor Force | Age 30-34
Demographics Similar to Whites/Caucasians by In Labor Force | Age 30-34
In terms of in labor force | age 30-34, the demographic groups most similar to Whites/Caucasians are Immigrants from St. Vincent and the Grenadines (83.9%, a difference of 0.020%), Nicaraguan (83.9%, a difference of 0.040%), Bahamian (83.9%, a difference of 0.040%), Immigrants from Nicaragua (83.9%, a difference of 0.040%), and Immigrants from Lebanon (83.9%, a difference of 0.040%).
| Demographics | Rating | Rank | In Labor Force | Age 30-34 |
| Portuguese | 0.8 /100 | #248 | Tragic 84.0% |
| Immigrants | Dominica | 0.7 /100 | #249 | Tragic 84.0% |
| Immigrants | Iraq | 0.7 /100 | #250 | Tragic 83.9% |
| Nicaraguans | 0.6 /100 | #251 | Tragic 83.9% |
| Bahamians | 0.6 /100 | #252 | Tragic 83.9% |
| Immigrants | Nicaragua | 0.6 /100 | #253 | Tragic 83.9% |
| Immigrants | St. Vincent and the Grenadines | 0.5 /100 | #254 | Tragic 83.9% |
| Whites/Caucasians | 0.5 /100 | #255 | Tragic 83.9% |
| Immigrants | Lebanon | 0.4 /100 | #256 | Tragic 83.9% |
| Iraqis | 0.3 /100 | #257 | Tragic 83.8% |
| Hondurans | 0.3 /100 | #258 | Tragic 83.8% |
| Scotch-Irish | 0.3 /100 | #259 | Tragic 83.8% |
| Immigrants | Dominican Republic | 0.3 /100 | #260 | Tragic 83.8% |
| Guyanese | 0.3 /100 | #261 | Tragic 83.8% |
| Dominicans | 0.2 /100 | #262 | Tragic 83.8% |
Demographics Similar to Serbians by In Labor Force | Age 30-34
In terms of in labor force | age 30-34, the demographic groups most similar to Serbians are Ugandan (85.8%, a difference of 0.0%), Albanian (85.7%, a difference of 0.0%), Immigrants from Bosnia and Herzegovina (85.8%, a difference of 0.010%), Norwegian (85.7%, a difference of 0.010%), and Immigrants from Greece (85.7%, a difference of 0.020%).
| Demographics | Rating | Rank | In Labor Force | Age 30-34 |
| Immigrants | Latvia | 100.0 /100 | #28 | Exceptional 85.9% |
| Tsimshian | 100.0 /100 | #29 | Exceptional 85.8% |
| Immigrants | Hong Kong | 100.0 /100 | #30 | Exceptional 85.8% |
| Paraguayans | 99.9 /100 | #31 | Exceptional 85.8% |
| Cypriots | 99.9 /100 | #32 | Exceptional 85.8% |
| Immigrants | Bosnia and Herzegovina | 99.9 /100 | #33 | Exceptional 85.8% |
| Ugandans | 99.9 /100 | #34 | Exceptional 85.8% |
| Serbians | 99.9 /100 | #35 | Exceptional 85.8% |
| Albanians | 99.9 /100 | #36 | Exceptional 85.7% |
| Norwegians | 99.9 /100 | #37 | Exceptional 85.7% |
| Immigrants | Greece | 99.9 /100 | #38 | Exceptional 85.7% |
| Eastern Europeans | 99.9 /100 | #39 | Exceptional 85.7% |
| Turks | 99.9 /100 | #40 | Exceptional 85.7% |
| Immigrants | Italy | 99.9 /100 | #41 | Exceptional 85.7% |
| Zimbabweans | 99.8 /100 | #42 | Exceptional 85.6% |