Immigrants from Grenada vs Serbian Married-couple Households
COMPARE
Immigrants from Grenada
Serbian
Married-couple Households
Married-couple Households Comparison
Immigrants from Grenada
Serbians
37.5%
MARRIED-COUPLE HOUSEHOLDS
0.0/ 100
METRIC RATING
343rd/ 347
METRIC RANK
47.0%
MARRIED-COUPLE HOUSEHOLDS
76.3/ 100
METRIC RATING
152nd/ 347
METRIC RANK
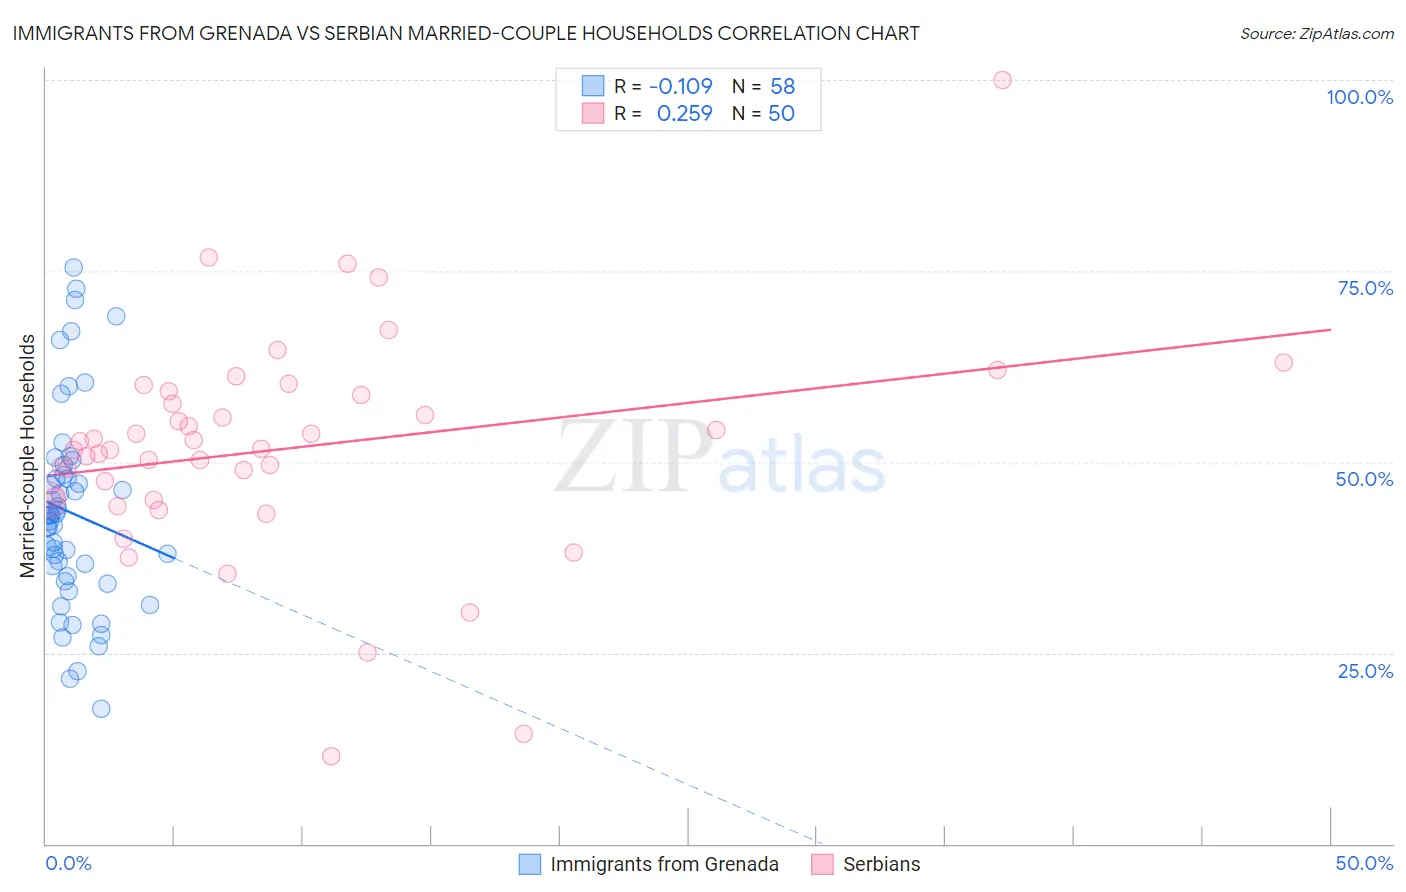
Immigrants from Grenada vs Serbian Married-couple Households Correlation Chart
The statistical analysis conducted on geographies consisting of 67,190,411 people shows a poor negative correlation between the proportion of Immigrants from Grenada and percentage of married-couple family households in the United States with a correlation coefficient (R) of -0.109 and weighted average of 37.5%. Similarly, the statistical analysis conducted on geographies consisting of 267,530,139 people shows a weak positive correlation between the proportion of Serbians and percentage of married-couple family households in the United States with a correlation coefficient (R) of 0.259 and weighted average of 47.0%, a difference of 25.2%.
Married-couple Households Correlation Summary
| Measurement | Immigrants from Grenada | Serbian |
| Minimum | 17.7% | 11.4% |
| Maximum | 75.4% | 100.0% |
| Range | 57.7% | 88.6% |
| Mean | 43.4% | 51.7% |
| Median | 43.0% | 51.7% |
| Interquartile 25% (IQ1) | 35.1% | 45.0% |
| Interquartile 75% (IQ3) | 48.3% | 58.7% |
| Interquartile Range (IQR) | 13.3% | 13.7% |
| Standard Deviation (Sample) | 12.9% | 14.6% |
| Standard Deviation (Population) | 12.8% | 14.5% |
Similar Demographics by Married-couple Households
Demographics Similar to Immigrants from Grenada by Married-couple Households
In terms of married-couple households, the demographic groups most similar to Immigrants from Grenada are Immigrants from Dominican Republic (37.3%, a difference of 0.43%), Tohono O'odham (37.9%, a difference of 1.1%), Cape Verdean (38.1%, a difference of 1.7%), Dominican (38.2%, a difference of 1.8%), and British West Indian (38.3%, a difference of 2.2%).
| Demographics | Rating | Rank | Married-couple Households |
| Immigrants | West Indies | 0.0 /100 | #333 | Tragic 39.0% |
| Immigrants | St. Vincent and the Grenadines | 0.0 /100 | #334 | Tragic 38.7% |
| Senegalese | 0.0 /100 | #335 | Tragic 38.6% |
| Blacks/African Americans | 0.0 /100 | #336 | Tragic 38.5% |
| Immigrants | Somalia | 0.0 /100 | #337 | Tragic 38.4% |
| Immigrants | Senegal | 0.0 /100 | #338 | Tragic 38.4% |
| British West Indians | 0.0 /100 | #339 | Tragic 38.3% |
| Dominicans | 0.0 /100 | #340 | Tragic 38.2% |
| Cape Verdeans | 0.0 /100 | #341 | Tragic 38.1% |
| Tohono O'odham | 0.0 /100 | #342 | Tragic 37.9% |
| Immigrants | Grenada | 0.0 /100 | #343 | Tragic 37.5% |
| Immigrants | Dominican Republic | 0.0 /100 | #344 | Tragic 37.3% |
| Hopi | 0.0 /100 | #345 | Tragic 36.7% |
| Immigrants | Cabo Verde | 0.0 /100 | #346 | Tragic 36.2% |
| Pima | 0.0 /100 | #347 | Tragic 35.6% |
Demographics Similar to Serbians by Married-couple Households
In terms of married-couple households, the demographic groups most similar to Serbians are Hmong (47.0%, a difference of 0.010%), Immigrants from Western Asia (46.9%, a difference of 0.010%), Immigrants from Bulgaria (47.0%, a difference of 0.020%), Arab (46.9%, a difference of 0.020%), and Armenian (46.9%, a difference of 0.050%).
| Demographics | Rating | Rank | Married-couple Households |
| Slovenes | 81.7 /100 | #145 | Excellent 47.1% |
| Immigrants | Western Europe | 81.6 /100 | #146 | Excellent 47.1% |
| Immigrants | Syria | 81.6 /100 | #147 | Excellent 47.1% |
| Icelanders | 79.5 /100 | #148 | Good 47.0% |
| Paraguayans | 78.7 /100 | #149 | Good 47.0% |
| Immigrants | Russia | 77.6 /100 | #150 | Good 47.0% |
| Immigrants | Bulgaria | 76.8 /100 | #151 | Good 47.0% |
| Serbians | 76.3 /100 | #152 | Good 47.0% |
| Hmong | 76.2 /100 | #153 | Good 47.0% |
| Immigrants | Western Asia | 76.1 /100 | #154 | Good 46.9% |
| Arabs | 76.0 /100 | #155 | Good 46.9% |
| Armenians | 75.4 /100 | #156 | Good 46.9% |
| Immigrants | Oceania | 74.8 /100 | #157 | Good 46.9% |
| Immigrants | Nonimmigrants | 73.3 /100 | #158 | Good 46.9% |
| Osage | 73.2 /100 | #159 | Good 46.9% |