White/Caucasian vs Immigrants from Sudan Average Family Size
COMPARE
White/Caucasian
Immigrants from Sudan
Average Family Size
Average Family Size Comparison
Whites/Caucasians
Immigrants from Sudan
3.14
AVERAGE FAMILY SIZE
0.3/ 100
METRIC RATING
285th/ 347
METRIC RANK
3.22
AVERAGE FAMILY SIZE
29.1/ 100
METRIC RATING
194th/ 347
METRIC RANK
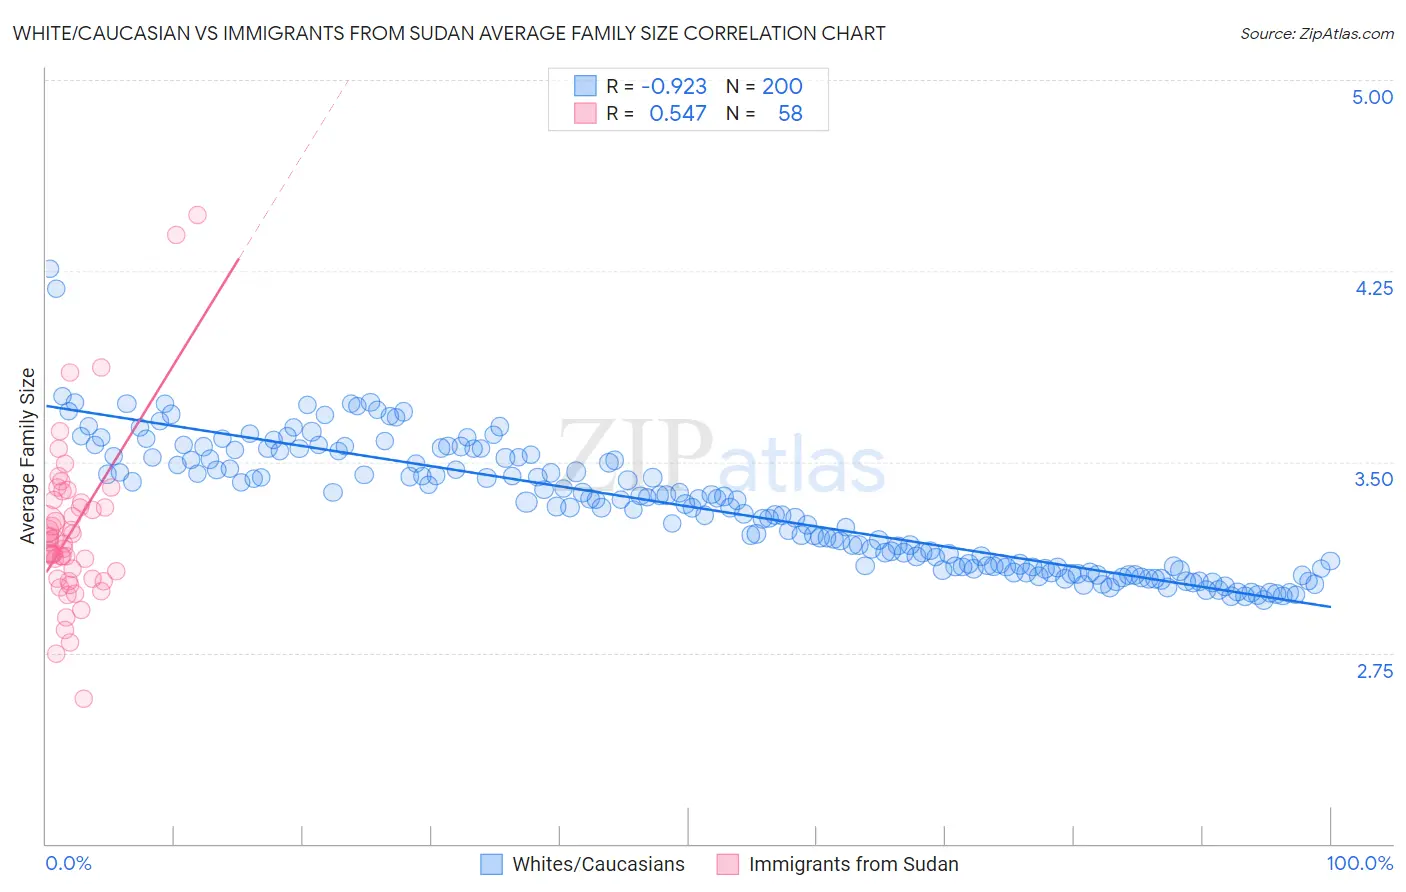
White/Caucasian vs Immigrants from Sudan Average Family Size Correlation Chart
The statistical analysis conducted on geographies consisting of 584,525,704 people shows a near-perfect negative correlation between the proportion of Whites/Caucasians and average family size in the United States with a correlation coefficient (R) of -0.923 and weighted average of 3.14. Similarly, the statistical analysis conducted on geographies consisting of 118,946,972 people shows a substantial positive correlation between the proportion of Immigrants from Sudan and average family size in the United States with a correlation coefficient (R) of 0.547 and weighted average of 3.22, a difference of 2.3%.
Average Family Size Correlation Summary
| Measurement | White/Caucasian | Immigrants from Sudan |
| Minimum | 2.96 | 2.57 |
| Maximum | 4.26 | 4.47 |
| Range | 1.30 | 1.90 |
| Mean | 3.32 | 3.23 |
| Median | 3.33 | 3.18 |
| Interquartile 25% (IQ1) | 3.09 | 3.04 |
| Interquartile 75% (IQ3) | 3.52 | 3.34 |
| Interquartile Range (IQR) | 0.43 | 0.30 |
| Standard Deviation (Sample) | 0.25 | 0.33 |
| Standard Deviation (Population) | 0.25 | 0.32 |
Similar Demographics by Average Family Size
Demographics Similar to Whites/Caucasians by Average Family Size
In terms of average family size, the demographic groups most similar to Whites/Caucasians are Immigrants from France (3.15, a difference of 0.050%), Immigrants from Netherlands (3.14, a difference of 0.050%), Greek (3.14, a difference of 0.060%), Immigrants from Czechoslovakia (3.14, a difference of 0.060%), and Immigrants from Norway (3.14, a difference of 0.060%).
| Demographics | Rating | Rank | Average Family Size |
| Okinawans | 0.5 /100 | #278 | Tragic 3.15 |
| Immigrants | Europe | 0.5 /100 | #279 | Tragic 3.15 |
| Immigrants | England | 0.4 /100 | #280 | Tragic 3.15 |
| Immigrants | Denmark | 0.4 /100 | #281 | Tragic 3.15 |
| Yugoslavians | 0.4 /100 | #282 | Tragic 3.15 |
| German Russians | 0.4 /100 | #283 | Tragic 3.15 |
| Immigrants | France | 0.4 /100 | #284 | Tragic 3.15 |
| Whites/Caucasians | 0.3 /100 | #285 | Tragic 3.14 |
| Immigrants | Netherlands | 0.3 /100 | #286 | Tragic 3.14 |
| Greeks | 0.3 /100 | #287 | Tragic 3.14 |
| Immigrants | Czechoslovakia | 0.3 /100 | #288 | Tragic 3.14 |
| Immigrants | Norway | 0.3 /100 | #289 | Tragic 3.14 |
| Cypriots | 0.3 /100 | #290 | Tragic 3.14 |
| Alsatians | 0.2 /100 | #291 | Tragic 3.14 |
| Europeans | 0.2 /100 | #292 | Tragic 3.14 |
Demographics Similar to Immigrants from Sudan by Average Family Size
In terms of average family size, the demographic groups most similar to Immigrants from Sudan are Immigrants from Israel (3.22, a difference of 0.0%), Immigrants from Eastern Africa (3.22, a difference of 0.020%), Choctaw (3.21, a difference of 0.020%), Senegalese (3.21, a difference of 0.020%), and Kenyan (3.21, a difference of 0.020%).
| Demographics | Rating | Rank | Average Family Size |
| Immigrants | Malaysia | 39.0 /100 | #187 | Fair 3.22 |
| Thais | 38.3 /100 | #188 | Fair 3.22 |
| Pakistanis | 33.7 /100 | #189 | Fair 3.22 |
| Burmese | 31.0 /100 | #190 | Fair 3.22 |
| Immigrants | Zaire | 30.5 /100 | #191 | Fair 3.22 |
| Immigrants | Eastern Africa | 30.1 /100 | #192 | Fair 3.22 |
| Immigrants | Israel | 29.3 /100 | #193 | Fair 3.22 |
| Immigrants | Sudan | 29.1 /100 | #194 | Fair 3.22 |
| Choctaw | 28.3 /100 | #195 | Fair 3.21 |
| Senegalese | 28.2 /100 | #196 | Fair 3.21 |
| Kenyans | 28.0 /100 | #197 | Fair 3.21 |
| Immigrants | Azores | 21.7 /100 | #198 | Fair 3.21 |
| Hmong | 20.7 /100 | #199 | Fair 3.21 |
| Immigrants | Kenya | 19.2 /100 | #200 | Poor 3.21 |
| Immigrants | Morocco | 18.5 /100 | #201 | Poor 3.21 |