White/Caucasian vs Immigrants from Micronesia Average Family Size
COMPARE
White/Caucasian
Immigrants from Micronesia
Average Family Size
Average Family Size Comparison
Whites/Caucasians
Immigrants from Micronesia
3.14
AVERAGE FAMILY SIZE
0.3/ 100
METRIC RATING
285th/ 347
METRIC RANK
3.32
AVERAGE FAMILY SIZE
99.8/ 100
METRIC RATING
78th/ 347
METRIC RANK
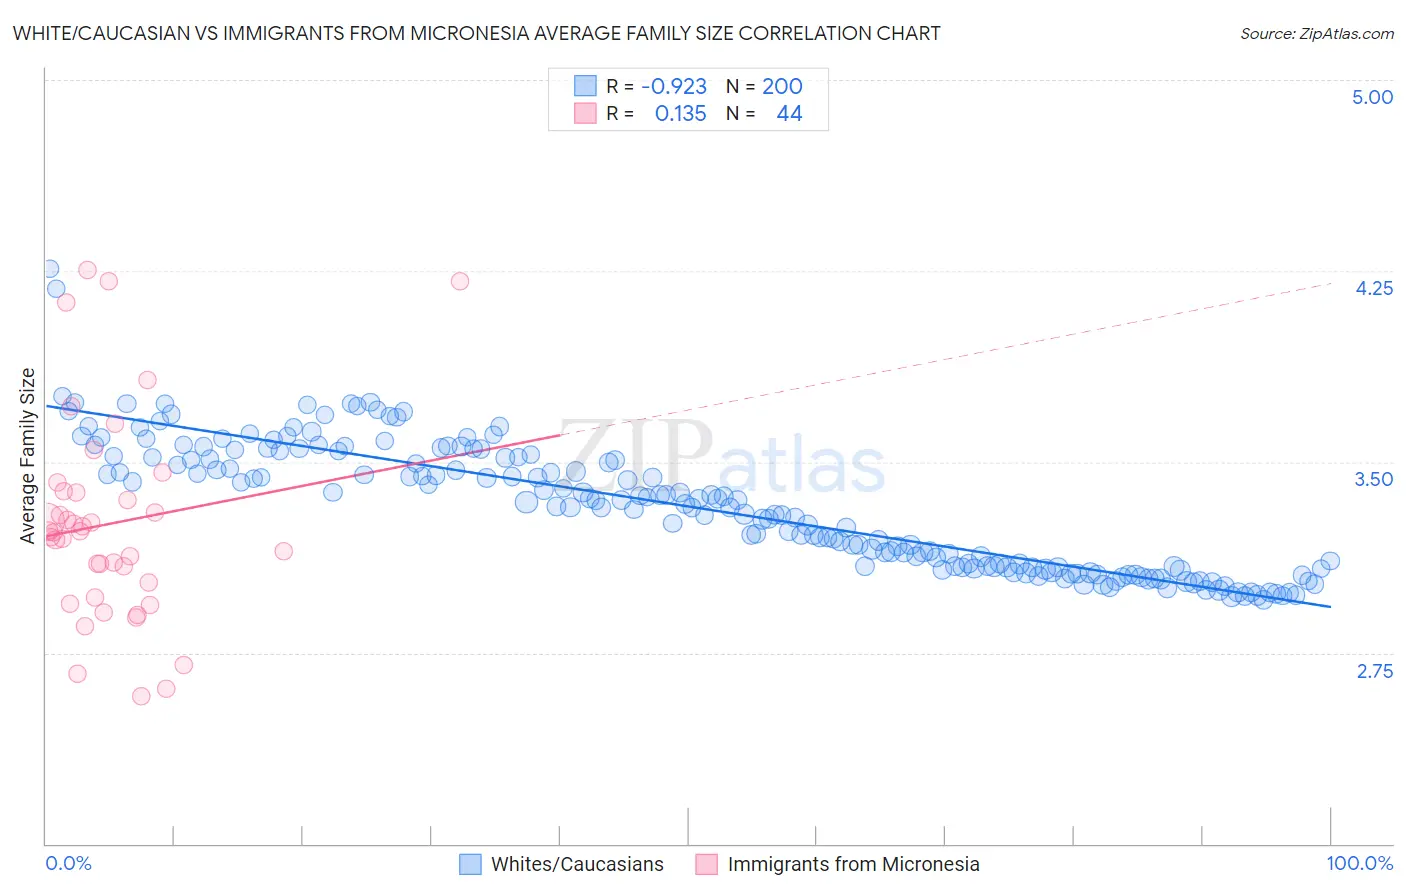
White/Caucasian vs Immigrants from Micronesia Average Family Size Correlation Chart
The statistical analysis conducted on geographies consisting of 584,525,704 people shows a near-perfect negative correlation between the proportion of Whites/Caucasians and average family size in the United States with a correlation coefficient (R) of -0.923 and weighted average of 3.14. Similarly, the statistical analysis conducted on geographies consisting of 61,601,070 people shows a poor positive correlation between the proportion of Immigrants from Micronesia and average family size in the United States with a correlation coefficient (R) of 0.135 and weighted average of 3.32, a difference of 5.6%.
Average Family Size Correlation Summary
| Measurement | White/Caucasian | Immigrants from Micronesia |
| Minimum | 2.96 | 2.58 |
| Maximum | 4.26 | 4.26 |
| Range | 1.30 | 1.68 |
| Mean | 3.32 | 3.26 |
| Median | 3.33 | 3.22 |
| Interquartile 25% (IQ1) | 3.09 | 3.00 |
| Interquartile 75% (IQ3) | 3.52 | 3.38 |
| Interquartile Range (IQR) | 0.43 | 0.39 |
| Standard Deviation (Sample) | 0.25 | 0.40 |
| Standard Deviation (Population) | 0.25 | 0.40 |
Similar Demographics by Average Family Size
Demographics Similar to Whites/Caucasians by Average Family Size
In terms of average family size, the demographic groups most similar to Whites/Caucasians are Immigrants from France (3.15, a difference of 0.050%), Immigrants from Netherlands (3.14, a difference of 0.050%), Greek (3.14, a difference of 0.060%), Immigrants from Czechoslovakia (3.14, a difference of 0.060%), and Immigrants from Norway (3.14, a difference of 0.060%).
| Demographics | Rating | Rank | Average Family Size |
| Okinawans | 0.5 /100 | #278 | Tragic 3.15 |
| Immigrants | Europe | 0.5 /100 | #279 | Tragic 3.15 |
| Immigrants | England | 0.4 /100 | #280 | Tragic 3.15 |
| Immigrants | Denmark | 0.4 /100 | #281 | Tragic 3.15 |
| Yugoslavians | 0.4 /100 | #282 | Tragic 3.15 |
| German Russians | 0.4 /100 | #283 | Tragic 3.15 |
| Immigrants | France | 0.4 /100 | #284 | Tragic 3.15 |
| Whites/Caucasians | 0.3 /100 | #285 | Tragic 3.14 |
| Immigrants | Netherlands | 0.3 /100 | #286 | Tragic 3.14 |
| Greeks | 0.3 /100 | #287 | Tragic 3.14 |
| Immigrants | Czechoslovakia | 0.3 /100 | #288 | Tragic 3.14 |
| Immigrants | Norway | 0.3 /100 | #289 | Tragic 3.14 |
| Cypriots | 0.3 /100 | #290 | Tragic 3.14 |
| Alsatians | 0.2 /100 | #291 | Tragic 3.14 |
| Europeans | 0.2 /100 | #292 | Tragic 3.14 |
Demographics Similar to Immigrants from Micronesia by Average Family Size
In terms of average family size, the demographic groups most similar to Immigrants from Micronesia are British West Indian (3.32, a difference of 0.010%), Lumbee (3.32, a difference of 0.030%), Immigrants from Ecuador (3.32, a difference of 0.040%), Trinidadian and Tobagonian (3.32, a difference of 0.050%), and Immigrants from Barbados (3.32, a difference of 0.070%).
| Demographics | Rating | Rank | Average Family Size |
| Immigrants | West Indies | 99.9 /100 | #71 | Exceptional 3.33 |
| Immigrants | Caribbean | 99.9 /100 | #72 | Exceptional 3.33 |
| Yaqui | 99.9 /100 | #73 | Exceptional 3.32 |
| Immigrants | Sierra Leone | 99.9 /100 | #74 | Exceptional 3.32 |
| Immigrants | Barbados | 99.8 /100 | #75 | Exceptional 3.32 |
| Trinidadians and Tobagonians | 99.8 /100 | #76 | Exceptional 3.32 |
| Immigrants | Ecuador | 99.8 /100 | #77 | Exceptional 3.32 |
| Immigrants | Micronesia | 99.8 /100 | #78 | Exceptional 3.32 |
| British West Indians | 99.8 /100 | #79 | Exceptional 3.32 |
| Lumbee | 99.8 /100 | #80 | Exceptional 3.32 |
| Immigrants | Dominica | 99.8 /100 | #81 | Exceptional 3.32 |
| Ecuadorians | 99.8 /100 | #82 | Exceptional 3.32 |
| Immigrants | Afghanistan | 99.8 /100 | #83 | Exceptional 3.32 |
| Immigrants | Nigeria | 99.7 /100 | #84 | Exceptional 3.32 |
| Afghans | 99.7 /100 | #85 | Exceptional 3.31 |