Latvian vs Immigrants from Sudan Average Family Size
COMPARE
Latvian
Immigrants from Sudan
Average Family Size
Average Family Size Comparison
Latvians
Immigrants from Sudan
3.11
AVERAGE FAMILY SIZE
0.0/ 100
METRIC RATING
330th/ 347
METRIC RANK
3.22
AVERAGE FAMILY SIZE
29.1/ 100
METRIC RATING
194th/ 347
METRIC RANK
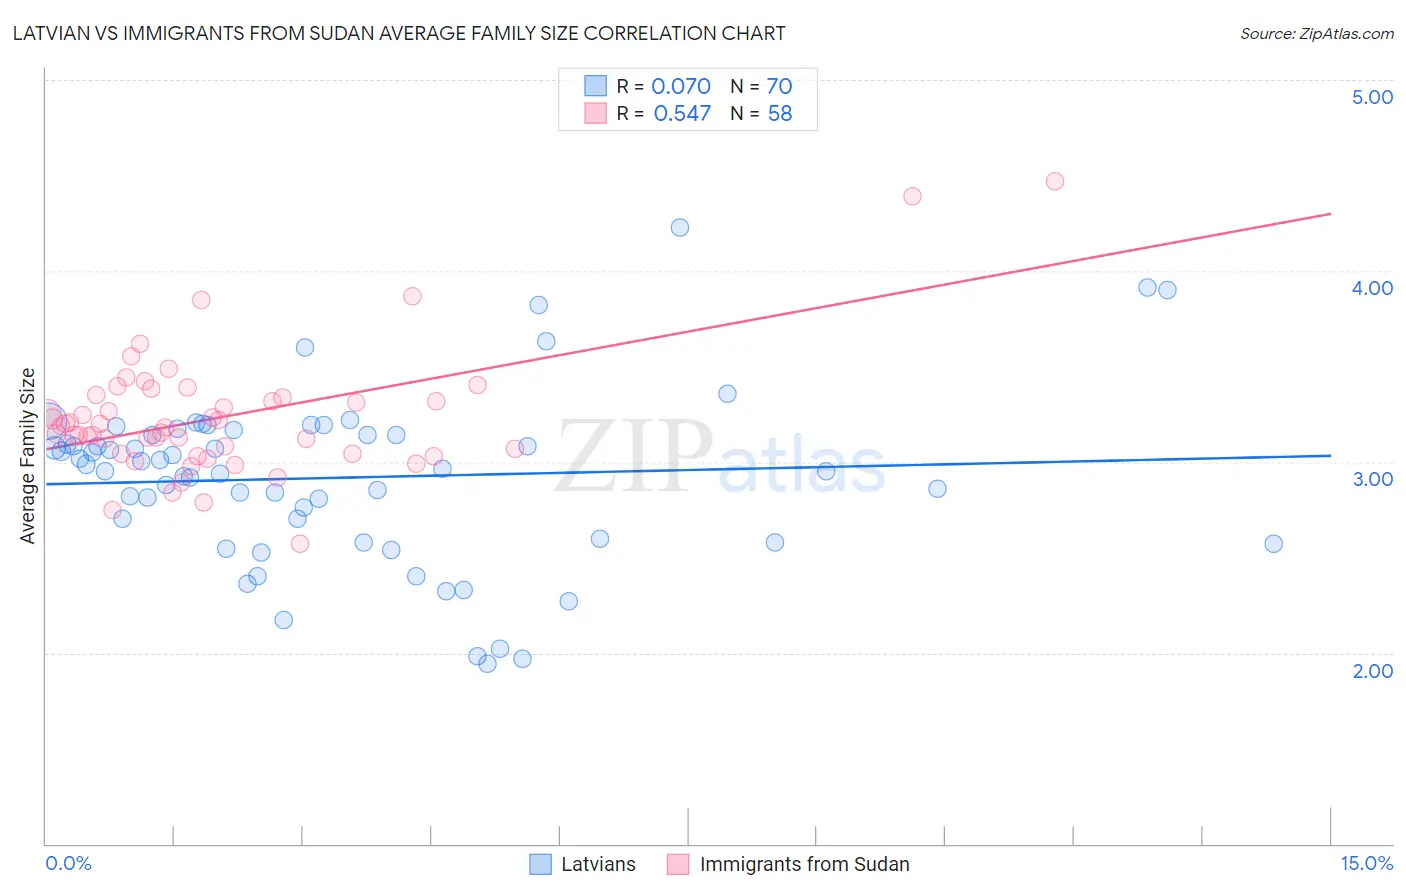
Latvian vs Immigrants from Sudan Average Family Size Correlation Chart
The statistical analysis conducted on geographies consisting of 220,660,131 people shows a slight positive correlation between the proportion of Latvians and average family size in the United States with a correlation coefficient (R) of 0.070 and weighted average of 3.11. Similarly, the statistical analysis conducted on geographies consisting of 118,946,972 people shows a substantial positive correlation between the proportion of Immigrants from Sudan and average family size in the United States with a correlation coefficient (R) of 0.547 and weighted average of 3.22, a difference of 3.5%.
Average Family Size Correlation Summary
| Measurement | Latvian | Immigrants from Sudan |
| Minimum | 1.94 | 2.57 |
| Maximum | 4.23 | 4.47 |
| Range | 2.29 | 1.90 |
| Mean | 2.92 | 3.23 |
| Median | 2.97 | 3.18 |
| Interquartile 25% (IQ1) | 2.60 | 3.04 |
| Interquartile 75% (IQ3) | 3.14 | 3.34 |
| Interquartile Range (IQR) | 0.54 | 0.30 |
| Standard Deviation (Sample) | 0.45 | 0.33 |
| Standard Deviation (Population) | 0.45 | 0.32 |
Similar Demographics by Average Family Size
Demographics Similar to Latvians by Average Family Size
In terms of average family size, the demographic groups most similar to Latvians are Scotch-Irish (3.11, a difference of 0.0%), Scottish (3.11, a difference of 0.010%), Estonian (3.10, a difference of 0.050%), Belgian (3.11, a difference of 0.060%), and Lithuanian (3.10, a difference of 0.060%).
| Demographics | Rating | Rank | Average Family Size |
| Soviet Union | 0.0 /100 | #323 | Tragic 3.11 |
| Celtics | 0.0 /100 | #324 | Tragic 3.11 |
| English | 0.0 /100 | #325 | Tragic 3.11 |
| Ottawa | 0.0 /100 | #326 | Tragic 3.11 |
| Dutch | 0.0 /100 | #327 | Tragic 3.11 |
| Czechs | 0.0 /100 | #328 | Tragic 3.11 |
| Belgians | 0.0 /100 | #329 | Tragic 3.11 |
| Latvians | 0.0 /100 | #330 | Tragic 3.11 |
| Scotch-Irish | 0.0 /100 | #331 | Tragic 3.11 |
| Scottish | 0.0 /100 | #332 | Tragic 3.11 |
| Estonians | 0.0 /100 | #333 | Tragic 3.10 |
| Lithuanians | 0.0 /100 | #334 | Tragic 3.10 |
| Luxembourgers | 0.0 /100 | #335 | Tragic 3.10 |
| Irish | 0.0 /100 | #336 | Tragic 3.10 |
| Swedes | 0.0 /100 | #337 | Tragic 3.10 |
Demographics Similar to Immigrants from Sudan by Average Family Size
In terms of average family size, the demographic groups most similar to Immigrants from Sudan are Immigrants from Israel (3.22, a difference of 0.0%), Immigrants from Eastern Africa (3.22, a difference of 0.020%), Choctaw (3.21, a difference of 0.020%), Senegalese (3.21, a difference of 0.020%), and Kenyan (3.21, a difference of 0.020%).
| Demographics | Rating | Rank | Average Family Size |
| Immigrants | Malaysia | 39.0 /100 | #187 | Fair 3.22 |
| Thais | 38.3 /100 | #188 | Fair 3.22 |
| Pakistanis | 33.7 /100 | #189 | Fair 3.22 |
| Burmese | 31.0 /100 | #190 | Fair 3.22 |
| Immigrants | Zaire | 30.5 /100 | #191 | Fair 3.22 |
| Immigrants | Eastern Africa | 30.1 /100 | #192 | Fair 3.22 |
| Immigrants | Israel | 29.3 /100 | #193 | Fair 3.22 |
| Immigrants | Sudan | 29.1 /100 | #194 | Fair 3.22 |
| Choctaw | 28.3 /100 | #195 | Fair 3.21 |
| Senegalese | 28.2 /100 | #196 | Fair 3.21 |
| Kenyans | 28.0 /100 | #197 | Fair 3.21 |
| Immigrants | Azores | 21.7 /100 | #198 | Fair 3.21 |
| Hmong | 20.7 /100 | #199 | Fair 3.21 |
| Immigrants | Kenya | 19.2 /100 | #200 | Poor 3.21 |
| Immigrants | Morocco | 18.5 /100 | #201 | Poor 3.21 |