White/Caucasian vs Native Hawaiian Average Family Size
COMPARE
White/Caucasian
Native Hawaiian
Average Family Size
Average Family Size Comparison
Whites/Caucasians
Native Hawaiians
3.14
AVERAGE FAMILY SIZE
0.3/ 100
METRIC RATING
285th/ 347
METRIC RANK
3.43
AVERAGE FAMILY SIZE
100.0/ 100
METRIC RATING
26th/ 347
METRIC RANK
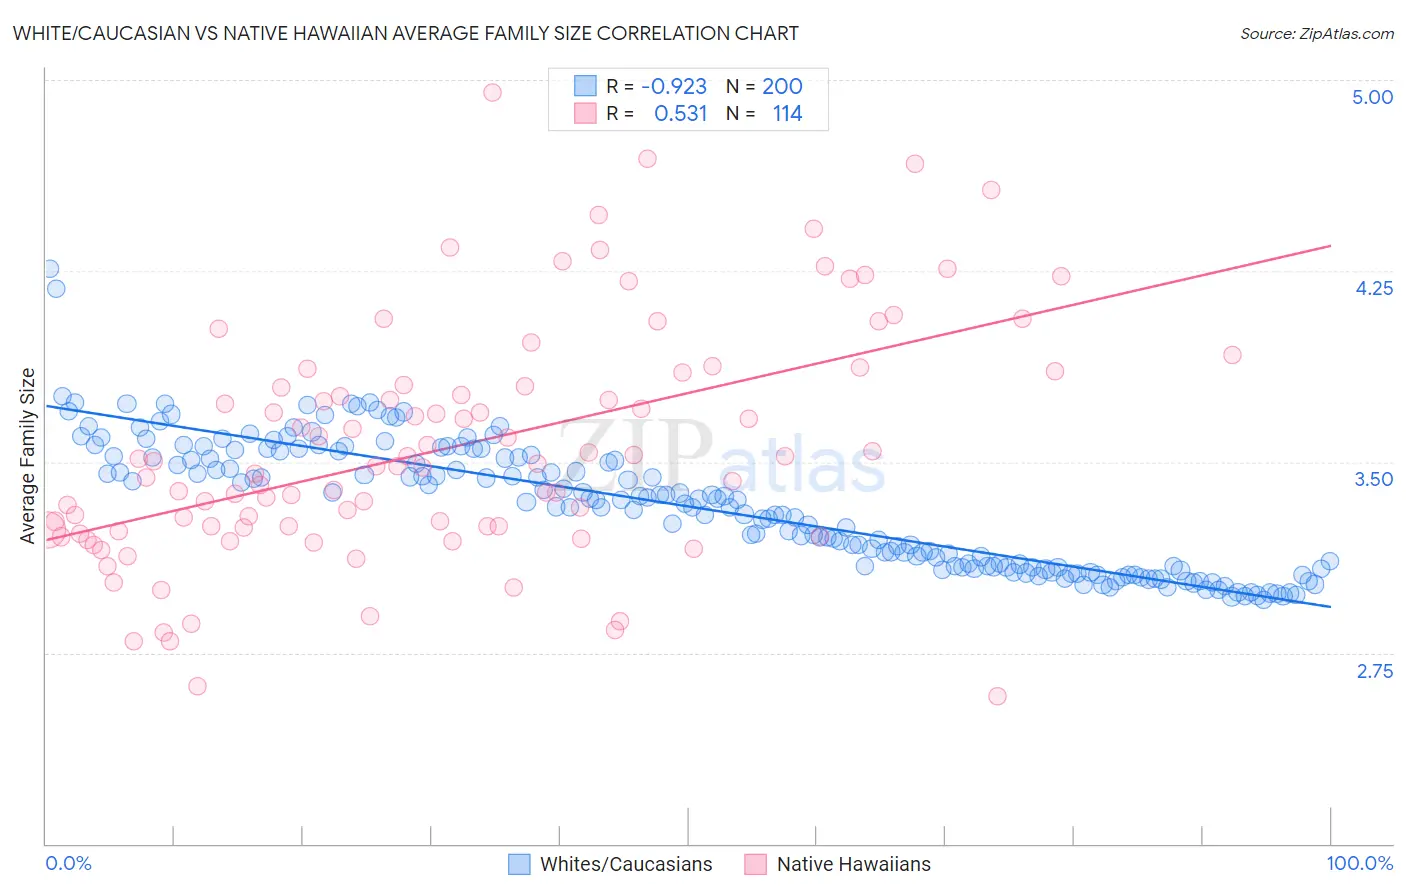
White/Caucasian vs Native Hawaiian Average Family Size Correlation Chart
The statistical analysis conducted on geographies consisting of 584,525,704 people shows a near-perfect negative correlation between the proportion of Whites/Caucasians and average family size in the United States with a correlation coefficient (R) of -0.923 and weighted average of 3.14. Similarly, the statistical analysis conducted on geographies consisting of 331,878,111 people shows a substantial positive correlation between the proportion of Native Hawaiians and average family size in the United States with a correlation coefficient (R) of 0.531 and weighted average of 3.43, a difference of 9.0%.
Average Family Size Correlation Summary
| Measurement | White/Caucasian | Native Hawaiian |
| Minimum | 2.96 | 2.58 |
| Maximum | 4.26 | 4.95 |
| Range | 1.30 | 2.37 |
| Mean | 3.32 | 3.56 |
| Median | 3.33 | 3.49 |
| Interquartile 25% (IQ1) | 3.09 | 3.24 |
| Interquartile 75% (IQ3) | 3.52 | 3.80 |
| Interquartile Range (IQR) | 0.43 | 0.56 |
| Standard Deviation (Sample) | 0.25 | 0.47 |
| Standard Deviation (Population) | 0.25 | 0.46 |
Similar Demographics by Average Family Size
Demographics Similar to Whites/Caucasians by Average Family Size
In terms of average family size, the demographic groups most similar to Whites/Caucasians are Immigrants from France (3.15, a difference of 0.050%), Immigrants from Netherlands (3.14, a difference of 0.050%), Greek (3.14, a difference of 0.060%), Immigrants from Czechoslovakia (3.14, a difference of 0.060%), and Immigrants from Norway (3.14, a difference of 0.060%).
| Demographics | Rating | Rank | Average Family Size |
| Okinawans | 0.5 /100 | #278 | Tragic 3.15 |
| Immigrants | Europe | 0.5 /100 | #279 | Tragic 3.15 |
| Immigrants | England | 0.4 /100 | #280 | Tragic 3.15 |
| Immigrants | Denmark | 0.4 /100 | #281 | Tragic 3.15 |
| Yugoslavians | 0.4 /100 | #282 | Tragic 3.15 |
| German Russians | 0.4 /100 | #283 | Tragic 3.15 |
| Immigrants | France | 0.4 /100 | #284 | Tragic 3.15 |
| Whites/Caucasians | 0.3 /100 | #285 | Tragic 3.14 |
| Immigrants | Netherlands | 0.3 /100 | #286 | Tragic 3.14 |
| Greeks | 0.3 /100 | #287 | Tragic 3.14 |
| Immigrants | Czechoslovakia | 0.3 /100 | #288 | Tragic 3.14 |
| Immigrants | Norway | 0.3 /100 | #289 | Tragic 3.14 |
| Cypriots | 0.3 /100 | #290 | Tragic 3.14 |
| Alsatians | 0.2 /100 | #291 | Tragic 3.14 |
| Europeans | 0.2 /100 | #292 | Tragic 3.14 |
Demographics Similar to Native Hawaiians by Average Family Size
In terms of average family size, the demographic groups most similar to Native Hawaiians are Mexican American Indian (3.43, a difference of 0.010%), Immigrants from Latin America (3.42, a difference of 0.13%), Nepalese (3.42, a difference of 0.22%), Samoan (3.42, a difference of 0.25%), and Central American (3.41, a difference of 0.45%).
| Demographics | Rating | Rank | Average Family Size |
| Mexicans | 100.0 /100 | #19 | Exceptional 3.48 |
| Cheyenne | 100.0 /100 | #20 | Exceptional 3.47 |
| Yuman | 100.0 /100 | #21 | Exceptional 3.47 |
| Apache | 100.0 /100 | #22 | Exceptional 3.46 |
| Immigrants | Fiji | 100.0 /100 | #23 | Exceptional 3.45 |
| Natives/Alaskans | 100.0 /100 | #24 | Exceptional 3.45 |
| Yakama | 100.0 /100 | #25 | Exceptional 3.45 |
| Native Hawaiians | 100.0 /100 | #26 | Exceptional 3.43 |
| Mexican American Indians | 100.0 /100 | #27 | Exceptional 3.43 |
| Immigrants | Latin America | 100.0 /100 | #28 | Exceptional 3.42 |
| Nepalese | 100.0 /100 | #29 | Exceptional 3.42 |
| Samoans | 100.0 /100 | #30 | Exceptional 3.42 |
| Central Americans | 100.0 /100 | #31 | Exceptional 3.41 |
| Immigrants | Guatemala | 100.0 /100 | #32 | Exceptional 3.41 |
| Hawaiians | 100.0 /100 | #33 | Exceptional 3.41 |