White/Caucasian vs Hungarian Average Family Size
COMPARE
White/Caucasian
Hungarian
Average Family Size
Average Family Size Comparison
Whites/Caucasians
Hungarians
3.14
AVERAGE FAMILY SIZE
0.3/ 100
METRIC RATING
285th/ 347
METRIC RANK
3.18
AVERAGE FAMILY SIZE
3.0/ 100
METRIC RATING
242nd/ 347
METRIC RANK
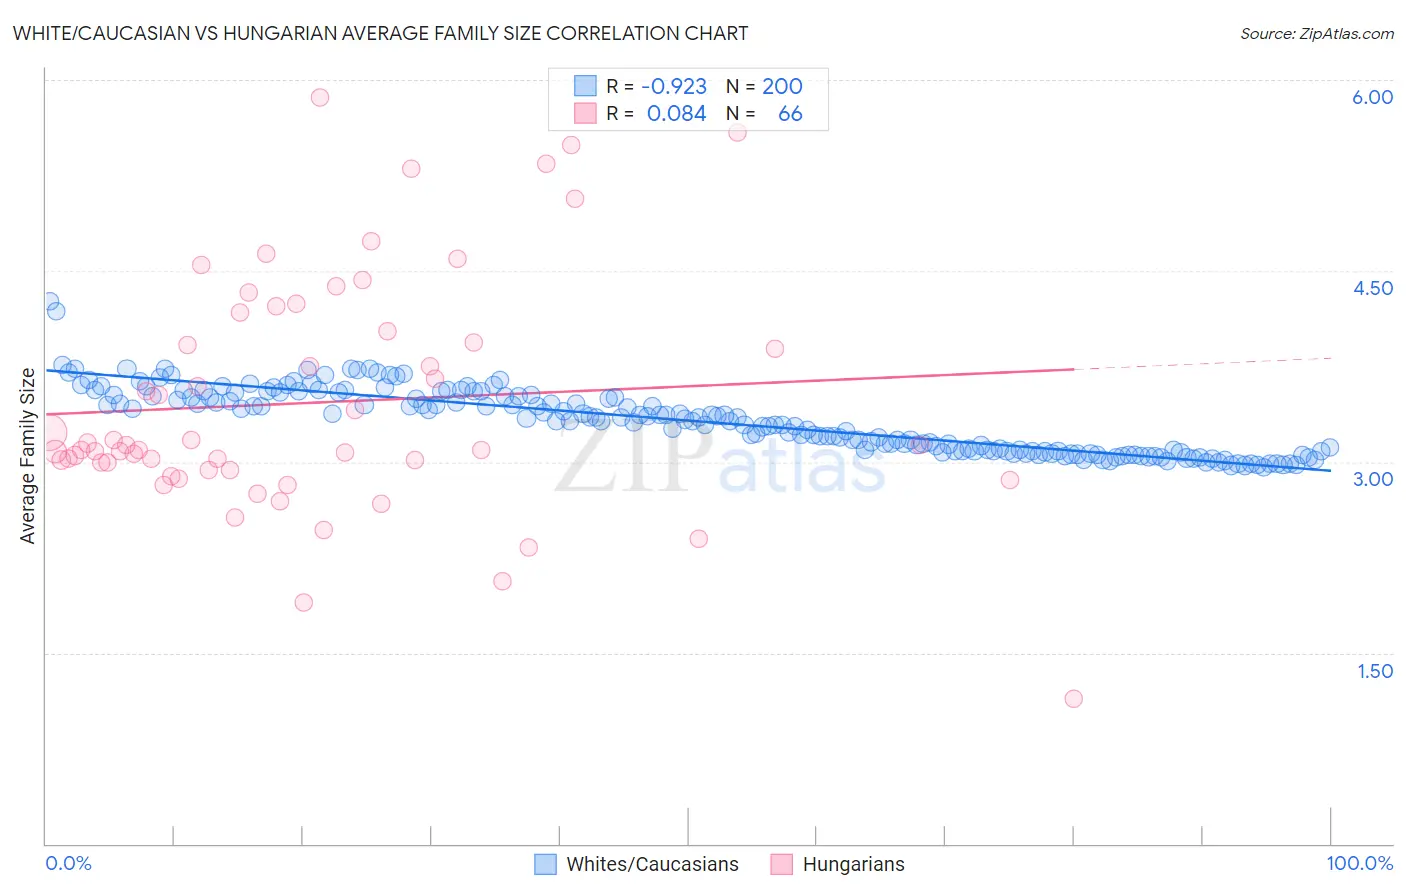
White/Caucasian vs Hungarian Average Family Size Correlation Chart
The statistical analysis conducted on geographies consisting of 584,525,704 people shows a near-perfect negative correlation between the proportion of Whites/Caucasians and average family size in the United States with a correlation coefficient (R) of -0.923 and weighted average of 3.14. Similarly, the statistical analysis conducted on geographies consisting of 485,906,700 people shows a slight positive correlation between the proportion of Hungarians and average family size in the United States with a correlation coefficient (R) of 0.084 and weighted average of 3.18, a difference of 1.0%.
Average Family Size Correlation Summary
| Measurement | White/Caucasian | Hungarian |
| Minimum | 2.96 | 1.14 |
| Maximum | 4.26 | 5.86 |
| Range | 1.30 | 4.72 |
| Mean | 3.32 | 3.47 |
| Median | 3.33 | 3.11 |
| Interquartile 25% (IQ1) | 3.09 | 2.94 |
| Interquartile 75% (IQ3) | 3.52 | 4.03 |
| Interquartile Range (IQR) | 0.43 | 1.09 |
| Standard Deviation (Sample) | 0.25 | 0.93 |
| Standard Deviation (Population) | 0.25 | 0.92 |
Similar Demographics by Average Family Size
Demographics Similar to Whites/Caucasians by Average Family Size
In terms of average family size, the demographic groups most similar to Whites/Caucasians are Immigrants from France (3.15, a difference of 0.050%), Immigrants from Netherlands (3.14, a difference of 0.050%), Greek (3.14, a difference of 0.060%), Immigrants from Czechoslovakia (3.14, a difference of 0.060%), and Immigrants from Norway (3.14, a difference of 0.060%).
| Demographics | Rating | Rank | Average Family Size |
| Okinawans | 0.5 /100 | #278 | Tragic 3.15 |
| Immigrants | Europe | 0.5 /100 | #279 | Tragic 3.15 |
| Immigrants | England | 0.4 /100 | #280 | Tragic 3.15 |
| Immigrants | Denmark | 0.4 /100 | #281 | Tragic 3.15 |
| Yugoslavians | 0.4 /100 | #282 | Tragic 3.15 |
| German Russians | 0.4 /100 | #283 | Tragic 3.15 |
| Immigrants | France | 0.4 /100 | #284 | Tragic 3.15 |
| Whites/Caucasians | 0.3 /100 | #285 | Tragic 3.14 |
| Immigrants | Netherlands | 0.3 /100 | #286 | Tragic 3.14 |
| Greeks | 0.3 /100 | #287 | Tragic 3.14 |
| Immigrants | Czechoslovakia | 0.3 /100 | #288 | Tragic 3.14 |
| Immigrants | Norway | 0.3 /100 | #289 | Tragic 3.14 |
| Cypriots | 0.3 /100 | #290 | Tragic 3.14 |
| Alsatians | 0.2 /100 | #291 | Tragic 3.14 |
| Europeans | 0.2 /100 | #292 | Tragic 3.14 |
Demographics Similar to Hungarians by Average Family Size
In terms of average family size, the demographic groups most similar to Hungarians are Immigrants from Moldova (3.18, a difference of 0.0%), Immigrants from Southern Europe (3.18, a difference of 0.010%), Immigrants from Japan (3.18, a difference of 0.020%), Osage (3.18, a difference of 0.040%), and Immigrants from Brazil (3.18, a difference of 0.040%).
| Demographics | Rating | Rank | Average Family Size |
| Immigrants | Turkey | 4.2 /100 | #235 | Tragic 3.18 |
| Immigrants | Portugal | 4.2 /100 | #236 | Tragic 3.18 |
| Immigrants | Romania | 3.7 /100 | #237 | Tragic 3.18 |
| Romanians | 3.7 /100 | #238 | Tragic 3.18 |
| Houma | 3.4 /100 | #239 | Tragic 3.18 |
| Osage | 3.2 /100 | #240 | Tragic 3.18 |
| Immigrants | Japan | 3.0 /100 | #241 | Tragic 3.18 |
| Hungarians | 3.0 /100 | #242 | Tragic 3.18 |
| Immigrants | Moldova | 2.9 /100 | #243 | Tragic 3.18 |
| Immigrants | Southern Europe | 2.9 /100 | #244 | Tragic 3.18 |
| Immigrants | Brazil | 2.7 /100 | #245 | Tragic 3.18 |
| Danes | 2.5 /100 | #246 | Tragic 3.17 |
| Cajuns | 2.4 /100 | #247 | Tragic 3.17 |
| Immigrants | Belarus | 2.3 /100 | #248 | Tragic 3.17 |
| Immigrants | Eastern Europe | 2.1 /100 | #249 | Tragic 3.17 |