Yup'ik vs Immigrants from Sudan Average Family Size
COMPARE
Yup'ik
Immigrants from Sudan
Average Family Size
Average Family Size Comparison
Yup'ik
Immigrants from Sudan
4.00
AVERAGE FAMILY SIZE
100/ 100
METRIC RATING
1st/ 347
METRIC RANK
3.22
AVERAGE FAMILY SIZE
29.1/ 100
METRIC RATING
194th/ 347
METRIC RANK
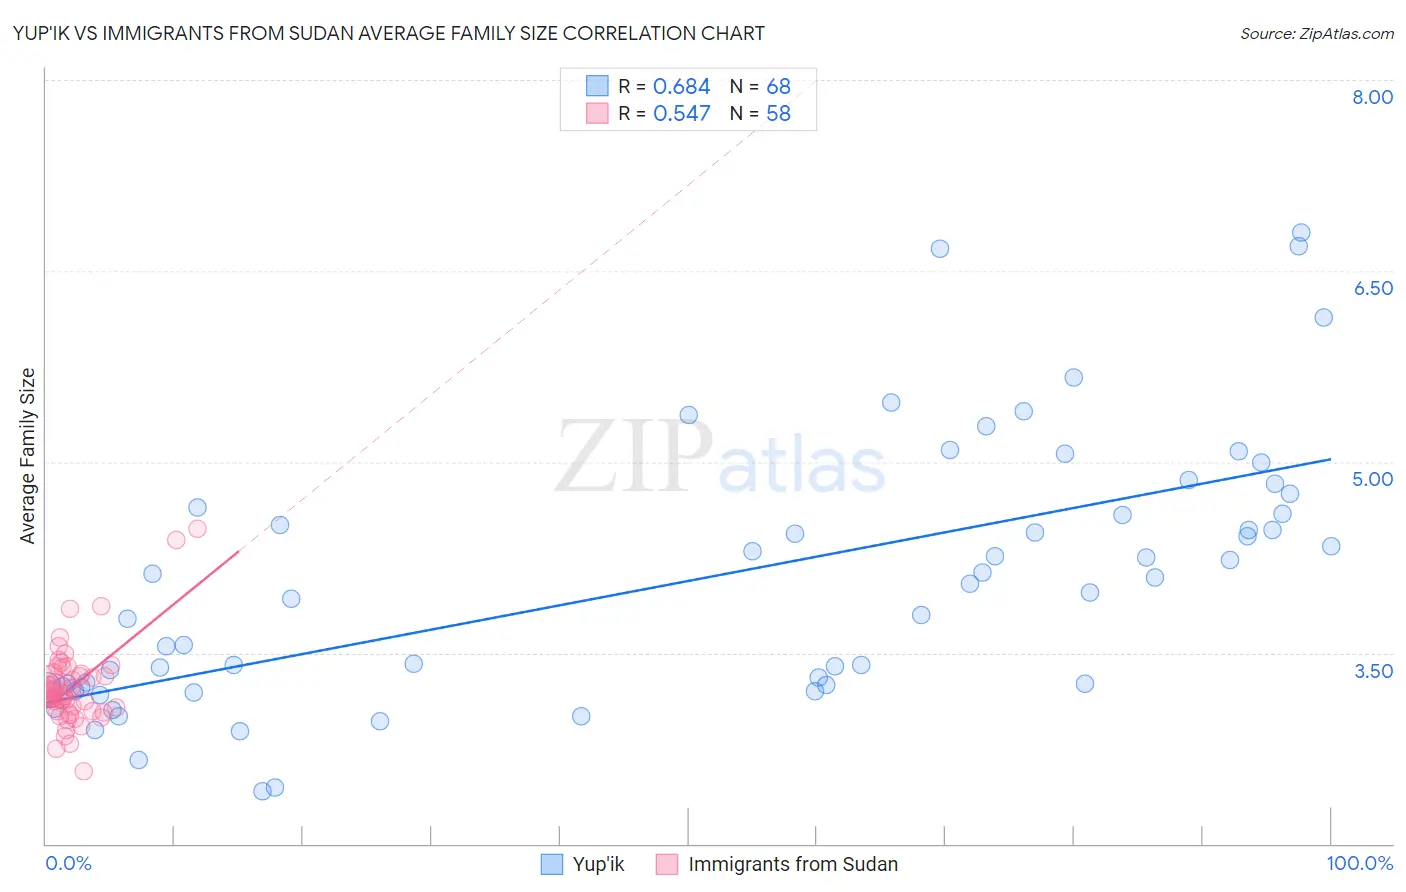
Yup'ik vs Immigrants from Sudan Average Family Size Correlation Chart
The statistical analysis conducted on geographies consisting of 39,956,738 people shows a significant positive correlation between the proportion of Yup'ik and average family size in the United States with a correlation coefficient (R) of 0.684 and weighted average of 4.00. Similarly, the statistical analysis conducted on geographies consisting of 118,946,972 people shows a substantial positive correlation between the proportion of Immigrants from Sudan and average family size in the United States with a correlation coefficient (R) of 0.547 and weighted average of 3.22, a difference of 24.3%.
Average Family Size Correlation Summary
| Measurement | Yup'ik | Immigrants from Sudan |
| Minimum | 2.41 | 2.57 |
| Maximum | 6.80 | 4.47 |
| Range | 4.39 | 1.90 |
| Mean | 4.07 | 3.23 |
| Median | 4.01 | 3.18 |
| Interquartile 25% (IQ1) | 3.25 | 3.04 |
| Interquartile 75% (IQ3) | 4.61 | 3.34 |
| Interquartile Range (IQR) | 1.37 | 0.30 |
| Standard Deviation (Sample) | 1.02 | 0.33 |
| Standard Deviation (Population) | 1.01 | 0.32 |
Similar Demographics by Average Family Size
Demographics Similar to Yup'ik by Average Family Size
In terms of average family size, the demographic groups most similar to Yup'ik are Crow (3.82, a difference of 4.5%), Pueblo (3.79, a difference of 5.3%), Pima (3.75, a difference of 6.7%), Navajo (3.65, a difference of 9.6%), and Arapaho (3.64, a difference of 9.9%).
| Demographics | Rating | Rank | Average Family Size |
| Yup'ik | 100 /100 | #1 | Exceptional 4.00 |
| Crow | 100 /100 | #2 | Exceptional 3.82 |
| Pueblo | 100 /100 | #3 | Exceptional 3.79 |
| Pima | 100 /100 | #4 | Exceptional 3.75 |
| Navajo | 100.0 /100 | #5 | Exceptional 3.65 |
| Arapaho | 100.0 /100 | #6 | Exceptional 3.64 |
| Inupiat | 100.0 /100 | #7 | Exceptional 3.63 |
| Immigrants | Yemen | 100.0 /100 | #8 | Exceptional 3.60 |
| Hopi | 100.0 /100 | #9 | Exceptional 3.60 |
| Spanish American Indians | 100.0 /100 | #10 | Exceptional 3.58 |
| Tohono O'odham | 100.0 /100 | #11 | Exceptional 3.53 |
| Immigrants | Mexico | 100.0 /100 | #12 | Exceptional 3.52 |
| Sioux | 100.0 /100 | #13 | Exceptional 3.52 |
| Immigrants | Central America | 100.0 /100 | #14 | Exceptional 3.49 |
| Tongans | 100.0 /100 | #15 | Exceptional 3.49 |
Demographics Similar to Immigrants from Sudan by Average Family Size
In terms of average family size, the demographic groups most similar to Immigrants from Sudan are Immigrants from Israel (3.22, a difference of 0.0%), Immigrants from Eastern Africa (3.22, a difference of 0.020%), Choctaw (3.21, a difference of 0.020%), Senegalese (3.21, a difference of 0.020%), and Kenyan (3.21, a difference of 0.020%).
| Demographics | Rating | Rank | Average Family Size |
| Immigrants | Malaysia | 39.0 /100 | #187 | Fair 3.22 |
| Thais | 38.3 /100 | #188 | Fair 3.22 |
| Pakistanis | 33.7 /100 | #189 | Fair 3.22 |
| Burmese | 31.0 /100 | #190 | Fair 3.22 |
| Immigrants | Zaire | 30.5 /100 | #191 | Fair 3.22 |
| Immigrants | Eastern Africa | 30.1 /100 | #192 | Fair 3.22 |
| Immigrants | Israel | 29.3 /100 | #193 | Fair 3.22 |
| Immigrants | Sudan | 29.1 /100 | #194 | Fair 3.22 |
| Choctaw | 28.3 /100 | #195 | Fair 3.21 |
| Senegalese | 28.2 /100 | #196 | Fair 3.21 |
| Kenyans | 28.0 /100 | #197 | Fair 3.21 |
| Immigrants | Azores | 21.7 /100 | #198 | Fair 3.21 |
| Hmong | 20.7 /100 | #199 | Fair 3.21 |
| Immigrants | Kenya | 19.2 /100 | #200 | Poor 3.21 |
| Immigrants | Morocco | 18.5 /100 | #201 | Poor 3.21 |