White/Caucasian vs Immigrants from Belize Average Family Size
COMPARE
White/Caucasian
Immigrants from Belize
Average Family Size
Average Family Size Comparison
Whites/Caucasians
Immigrants from Belize
3.14
AVERAGE FAMILY SIZE
0.3/ 100
METRIC RATING
285th/ 347
METRIC RANK
3.39
AVERAGE FAMILY SIZE
100.0/ 100
METRIC RATING
38th/ 347
METRIC RANK
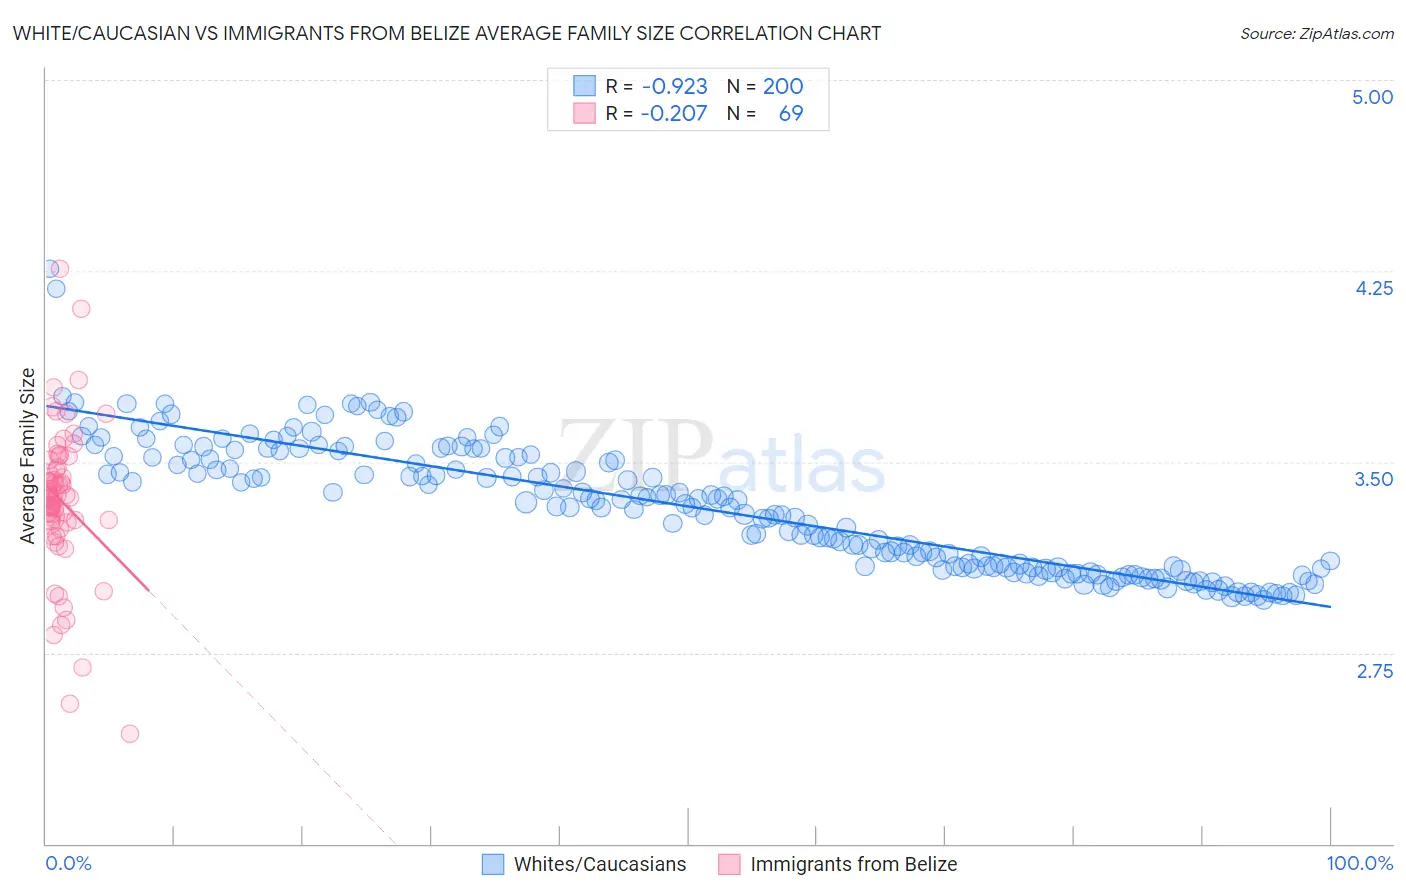
White/Caucasian vs Immigrants from Belize Average Family Size Correlation Chart
The statistical analysis conducted on geographies consisting of 584,525,704 people shows a near-perfect negative correlation between the proportion of Whites/Caucasians and average family size in the United States with a correlation coefficient (R) of -0.923 and weighted average of 3.14. Similarly, the statistical analysis conducted on geographies consisting of 130,207,410 people shows a weak negative correlation between the proportion of Immigrants from Belize and average family size in the United States with a correlation coefficient (R) of -0.207 and weighted average of 3.39, a difference of 7.9%.
Average Family Size Correlation Summary
| Measurement | White/Caucasian | Immigrants from Belize |
| Minimum | 2.96 | 2.43 |
| Maximum | 4.26 | 4.26 |
| Range | 1.30 | 1.83 |
| Mean | 3.32 | 3.35 |
| Median | 3.33 | 3.37 |
| Interquartile 25% (IQ1) | 3.09 | 3.26 |
| Interquartile 75% (IQ3) | 3.52 | 3.49 |
| Interquartile Range (IQR) | 0.43 | 0.23 |
| Standard Deviation (Sample) | 0.25 | 0.30 |
| Standard Deviation (Population) | 0.25 | 0.30 |
Similar Demographics by Average Family Size
Demographics Similar to Whites/Caucasians by Average Family Size
In terms of average family size, the demographic groups most similar to Whites/Caucasians are Immigrants from France (3.15, a difference of 0.050%), Immigrants from Netherlands (3.14, a difference of 0.050%), Greek (3.14, a difference of 0.060%), Immigrants from Czechoslovakia (3.14, a difference of 0.060%), and Immigrants from Norway (3.14, a difference of 0.060%).
| Demographics | Rating | Rank | Average Family Size |
| Okinawans | 0.5 /100 | #278 | Tragic 3.15 |
| Immigrants | Europe | 0.5 /100 | #279 | Tragic 3.15 |
| Immigrants | England | 0.4 /100 | #280 | Tragic 3.15 |
| Immigrants | Denmark | 0.4 /100 | #281 | Tragic 3.15 |
| Yugoslavians | 0.4 /100 | #282 | Tragic 3.15 |
| German Russians | 0.4 /100 | #283 | Tragic 3.15 |
| Immigrants | France | 0.4 /100 | #284 | Tragic 3.15 |
| Whites/Caucasians | 0.3 /100 | #285 | Tragic 3.14 |
| Immigrants | Netherlands | 0.3 /100 | #286 | Tragic 3.14 |
| Greeks | 0.3 /100 | #287 | Tragic 3.14 |
| Immigrants | Czechoslovakia | 0.3 /100 | #288 | Tragic 3.14 |
| Immigrants | Norway | 0.3 /100 | #289 | Tragic 3.14 |
| Cypriots | 0.3 /100 | #290 | Tragic 3.14 |
| Alsatians | 0.2 /100 | #291 | Tragic 3.14 |
| Europeans | 0.2 /100 | #292 | Tragic 3.14 |
Demographics Similar to Immigrants from Belize by Average Family Size
In terms of average family size, the demographic groups most similar to Immigrants from Belize are Immigrants from Haiti (3.39, a difference of 0.080%), Guyanese (3.40, a difference of 0.16%), Belizean (3.39, a difference of 0.20%), Immigrants from Guyana (3.40, a difference of 0.30%), and Guatemalan (3.40, a difference of 0.35%).
| Demographics | Rating | Rank | Average Family Size |
| Central Americans | 100.0 /100 | #31 | Exceptional 3.41 |
| Immigrants | Guatemala | 100.0 /100 | #32 | Exceptional 3.41 |
| Hawaiians | 100.0 /100 | #33 | Exceptional 3.41 |
| Hispanics or Latinos | 100.0 /100 | #34 | Exceptional 3.41 |
| Guatemalans | 100.0 /100 | #35 | Exceptional 3.40 |
| Immigrants | Guyana | 100.0 /100 | #36 | Exceptional 3.40 |
| Guyanese | 100.0 /100 | #37 | Exceptional 3.40 |
| Immigrants | Belize | 100.0 /100 | #38 | Exceptional 3.39 |
| Immigrants | Haiti | 100.0 /100 | #39 | Exceptional 3.39 |
| Belizeans | 100.0 /100 | #40 | Exceptional 3.39 |
| Marshallese | 100.0 /100 | #41 | Exceptional 3.38 |
| Immigrants | Vietnam | 100.0 /100 | #42 | Exceptional 3.38 |
| Immigrants | Philippines | 100.0 /100 | #43 | Exceptional 3.37 |
| Alaska Natives | 100.0 /100 | #44 | Exceptional 3.37 |
| Shoshone | 100.0 /100 | #45 | Exceptional 3.37 |