White/Caucasian vs Jamaican Average Family Size

COMPARE

White/Caucasian
Race
Ancestry
AfghanAfricanAlaska NativeAlaskan AthabascanAlbanianAleutAlsatianAmericanApacheArabArapahoArgentineanArmenianAssyrian/Chaldean/SyriacAustralianAustrianBahamianBangladeshiBarbadianBasqueBelgianBelizeanBermudanBhutaneseBlackfeetBolivianBrazilianBritishBritish West IndianBulgarianBurmeseCajunCambodianCanadianCape VerdeanCarpatho RusynCelticCentral AmericanCentral American IndianCherokeeCheyenneChickasawChileanChineseChippewaChoctawColombianColvilleComancheCosta RicanCreeCreekCroatianCrowCubanCypriotCzechCzechoslovakianDanishDelawareDominicanDutchDutch West IndianEastern EuropeanEcuadorianEgyptianEnglishEstonianEthiopianEuropeanFijianFilipinoFinnishFrenchFrench American IndianFrench CanadianGermanGerman RussianGhanaianGreekGuamanian/ChamorroGuatemalanGuyaneseHaitianHmongHonduranHopiHoumaHungarianIcelanderIndian (Asian)IndonesianInupiatIranianIraqiIrishIroquoisIsraeliItalianJapaneseJordanianKenyanKiowaKoreanLaotianLatvianLebaneseLiberianLithuanianLumbeeLuxembourgerMacedonianMalaysianMalteseMarshalleseMenomineeMexicanMexican American IndianMongolianMoroccanNative HawaiianNavajoNepaleseNew ZealanderNicaraguanNigerianNorthern EuropeanNorwegianOkinawanOsageOttawaPaiutePakistaniPalestinianPanamanianParaguayanPennsylvania GermanPeruvianPimaPolishPortuguesePotawatomiPuebloPuerto RicanPuget Sound SalishRomanianRussianSalvadoranSamoanScandinavianScotch-IrishScottishSeminoleSenegaleseSerbianShoshoneSierra LeoneanSiouxSlavicSlovakSloveneSomaliSouth AfricanSouth AmericanSouth American IndianSoviet UnionSpaniardSpanishSpanish AmericanSpanish American IndianSri LankanSubsaharan AfricanSudaneseSwedishSwissSyrianTaiwaneseThaiTlingit-HaidaTohono O'OdhamTonganTrinidadian and TobagonianTsimshianTurkishU.S. Virgin IslanderUgandanUkrainianUruguayanUteVenezuelanVietnameseWelshWest IndianYakamaYaquiYugoslavianYumanYup'ikZimbabwean
Immigration
NonimmigrantsImmigrantsAfghanistanAfricaAlbaniaArgentinaArmeniaAsiaAustraliaAustriaBahamasBangladeshBarbadosBelarusBelgiumBelizeBoliviaBosnia and HerzegovinaBrazilBulgariaBurma/MyanmarCabo VerdeCambodiaCameroonCanadaCaribbeanCentral AmericaChileChinaColombiaCongoCosta RicaCroatiaCubaCzechoslovakiaDenmarkDominicaDominican RepublicEastern AfricaEastern AsiaEastern EuropeEcuadorEgyptEl SalvadorEnglandEritreaEthiopiaEuropeFijiFranceGermanyGhanaGreeceGrenadaGuatemalaGuyanaHaitiHondurasHong KongHungaryIndiaIndonesiaIranIraqIrelandIsraelItalyJamaicaJapanJordanKazakhstanKenyaKoreaKuwaitLaosLatin AmericaLatviaLebanonLiberiaLithuaniaMalaysiaMexicoMicronesiaMiddle AfricaMoldovaMoroccoNepalNetherlandsNicaraguaNigeriaNorth AmericaNorth MacedoniaNorthern AfricaNorthern EuropeNorwayOceaniaPakistanPanamaPeruPhilippinesPolandPortugalRomaniaRussiaSaudi ArabiaScotlandSenegalSerbiaSierra LeoneSingaporeSomaliaSouth AfricaSouth AmericaSouth Central AsiaSouth Eastern AsiaSouthern EuropeSpainSri LankaSt. Vincent and the GrenadinesSudanSwedenSwitzerlandSyriaTaiwanThailandTrinidad and TobagoTurkeyUgandaUkraineUruguayUzbekistanVenezuelaVietnamWest IndiesWestern AfricaWestern AsiaWestern EuropeYemenZaireZimbabweAzores
Jamaican
Race
Ancestry
AfghanAfricanAlaska NativeAlaskan AthabascanAlbanianAleutAlsatianAmericanApacheArabArapahoArgentineanArmenianAssyrian/Chaldean/SyriacAustralianAustrianBahamianBangladeshiBarbadianBasqueBelgianBelizeanBermudanBhutaneseBlackfeetBolivianBrazilianBritishBritish West IndianBulgarianBurmeseCajunCambodianCanadianCape VerdeanCarpatho RusynCelticCentral AmericanCentral American IndianCherokeeCheyenneChickasawChileanChineseChippewaChoctawColombianColvilleComancheCosta RicanCreeCreekCroatianCrowCubanCypriotCzechCzechoslovakianDanishDelawareDominicanDutchDutch West IndianEastern EuropeanEcuadorianEgyptianEnglishEstonianEthiopianEuropeanFijianFilipinoFinnishFrenchFrench American IndianFrench CanadianGermanGerman RussianGhanaianGreekGuamanian/ChamorroGuatemalanGuyaneseHaitianHmongHonduranHopiHoumaHungarianIcelanderIndian (Asian)IndonesianInupiatIranianIraqiIrishIroquoisIsraeliItalianJamaicanJapaneseJordanianKenyanKiowaKoreanLaotianLatvianLebaneseLiberianLithuanianLumbeeLuxembourgerMacedonianMalaysianMalteseMarshalleseMenomineeMexicanMexican American IndianMongolianMoroccanNative HawaiianNavajoNepaleseNew ZealanderNicaraguanNigerianNorthern EuropeanNorwegianOkinawanOsageOttawaPaiutePakistaniPalestinianPanamanianParaguayanPennsylvania GermanPeruvianPimaPolishPortuguesePotawatomiPuebloPuerto RicanPuget Sound SalishRomanianRussianSalvadoranSamoanScandinavianScotch-IrishScottishSeminoleSenegaleseSerbianShoshoneSierra LeoneanSiouxSlavicSlovakSloveneSomaliSouth AfricanSouth AmericanSouth American IndianSoviet UnionSpaniardSpanishSpanish AmericanSpanish American IndianSri LankanSubsaharan AfricanSudaneseSwedishSwissSyrianTaiwaneseThaiTlingit-HaidaTohono O'OdhamTonganTrinidadian and TobagonianTsimshianTurkishU.S. Virgin IslanderUgandanUkrainianUruguayanUteVenezuelanVietnameseWelshWest IndianYakamaYaquiYugoslavianYumanYup'ikZimbabwean
Immigration
NonimmigrantsImmigrantsAfghanistanAfricaAlbaniaArgentinaArmeniaAsiaAustraliaAustriaBahamasBangladeshBarbadosBelarusBelgiumBelizeBoliviaBosnia and HerzegovinaBrazilBulgariaBurma/MyanmarCabo VerdeCambodiaCameroonCanadaCaribbeanCentral AmericaChileChinaColombiaCongoCosta RicaCroatiaCubaCzechoslovakiaDenmarkDominicaDominican RepublicEastern AfricaEastern AsiaEastern EuropeEcuadorEgyptEl SalvadorEnglandEritreaEthiopiaEuropeFijiFranceGermanyGhanaGreeceGrenadaGuatemalaGuyanaHaitiHondurasHong KongHungaryIndiaIndonesiaIranIraqIrelandIsraelItalyJamaicaJapanJordanKazakhstanKenyaKoreaKuwaitLaosLatin AmericaLatviaLebanonLiberiaLithuaniaMalaysiaMexicoMicronesiaMiddle AfricaMoldovaMoroccoNepalNetherlandsNicaraguaNigeriaNorth AmericaNorth MacedoniaNorthern AfricaNorthern EuropeNorwayOceaniaPakistanPanamaPeruPhilippinesPolandPortugalRomaniaRussiaSaudi ArabiaScotlandSenegalSerbiaSierra LeoneSingaporeSomaliaSouth AfricaSouth AmericaSouth Central AsiaSouth Eastern AsiaSouthern EuropeSpainSri LankaSt. Vincent and the GrenadinesSudanSwedenSwitzerlandSyriaTaiwanThailandTrinidad and TobagoTurkeyUgandaUkraineUruguayUzbekistanVenezuelaVietnamWest IndiesWestern AfricaWestern AsiaWestern EuropeYemenZaireZimbabweAzores
Average Family Size
Income
Poverty
Unemployment
Labor Participation
Family Structure
Vehicle Availability
Education Level
Disability

Average Family Size Comparison

Whites/Caucasians

Jamaicans

Tragic
Exceptional
3.14
AVERAGE FAMILY SIZE
0.3/ 100
METRIC RATING
285th/ 347
METRIC RANK
3.31
AVERAGE FAMILY SIZE
99.7/ 100
METRIC RATING
86th/ 347
METRIC RANK

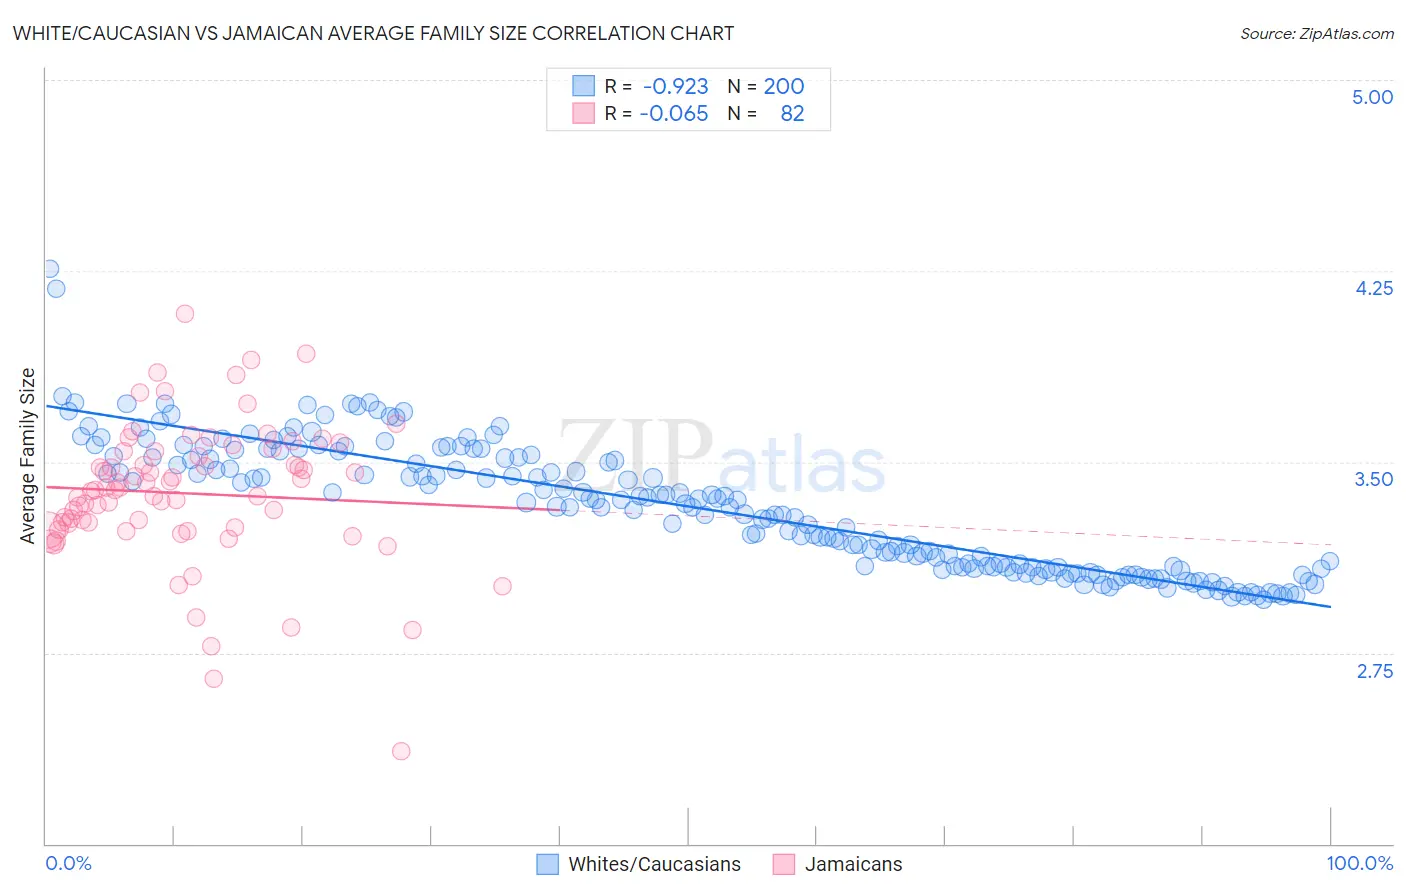
White/Caucasian vs Jamaican Average Family Size Correlation Chart

The statistical analysis conducted on geographies consisting of 584,525,704 people shows a near-perfect negative correlation between the proportion of Whites/Caucasians and average family size in the United States with a correlation coefficient (R) of -0.923 and weighted average of 3.14. Similarly, the statistical analysis conducted on geographies consisting of 367,646,796 people shows a slight negative correlation between the proportion of Jamaicans and average family size in the United States with a correlation coefficient (R) of -0.065 and weighted average of 3.31, a difference of 5.4%.
White/Caucasian vs Jamaican Average Family Size

Average Family Size Correlation Summary

MeasurementWhite/CaucasianJamaican
Minimum2.962.36
Maximum4.264.08
Range1.301.72
Mean3.323.38
Median3.333.39
Interquartile 25% (IQ1)3.093.24
Interquartile 75% (IQ3)3.523.54
Interquartile Range (IQR)0.430.30
Standard Deviation (Sample)0.250.28
Standard Deviation (Population)0.250.28

Similar Demographics by Average Family Size

Demographics Similar to Whites/Caucasians by Average Family Size

In terms of average family size, the demographic groups most similar to Whites/Caucasians are Immigrants from France (3.15, a difference of 0.050%), Immigrants from Netherlands (3.14, a difference of 0.050%), Greek (3.14, a difference of 0.060%), Immigrants from Czechoslovakia (3.14, a difference of 0.060%), and Immigrants from Norway (3.14, a difference of 0.060%).
DemographicsRating | RankAverage Family Size
Okinawans
0.5
/100
|
#278
Tragic
3.15
Immigrants | Europe
0.5
/100
|
#279
Tragic
3.15
Immigrants | England
0.4
/100
|
#280
Tragic
3.15
Immigrants | Denmark
0.4
/100
|
#281
Tragic
3.15
Yugoslavians
0.4
/100
|
#282
Tragic
3.15
German Russians
0.4
/100
|
#283
Tragic
3.15
Immigrants | France
0.4
/100
|
#284
Tragic
3.15
Whites/Caucasians
0.3
/100
|
#285
Tragic
3.14
Immigrants | Netherlands
0.3
/100
|
#286
Tragic
3.14
Greeks
0.3
/100
|
#287
Tragic
3.14
Immigrants | Czechoslovakia
0.3
/100
|
#288
Tragic
3.14
Immigrants | Norway
0.3
/100
|
#289
Tragic
3.14
Cypriots
0.3
/100
|
#290
Tragic
3.14
Alsatians
0.2
/100
|
#291
Tragic
3.14
Europeans
0.2
/100
|
#292
Tragic
3.14

Demographics Similar to Jamaicans by Average Family Size

In terms of average family size, the demographic groups most similar to Jamaicans are Afghan (3.31, a difference of 0.020%), Immigrants from Peru (3.31, a difference of 0.050%), Immigrants from Nigeria (3.32, a difference of 0.060%), Immigrants from Afghanistan (3.32, a difference of 0.10%), and Ecuadorian (3.32, a difference of 0.11%).
DemographicsRating | RankAverage Family Size
British West Indians
99.8
/100
|
#79
Exceptional
3.32
Lumbee
99.8
/100
|
#80
Exceptional
3.32
Immigrants | Dominica
99.8
/100
|
#81
Exceptional
3.32
Ecuadorians
99.8
/100
|
#82
Exceptional
3.32
Immigrants | Afghanistan
99.8
/100
|
#83
Exceptional
3.32
Immigrants | Nigeria
99.7
/100
|
#84
Exceptional
3.32
Afghans
99.7
/100
|
#85
Exceptional
3.31
Jamaicans
99.7
/100
|
#86
Exceptional
3.31
Immigrants | Peru
99.7
/100
|
#87
Exceptional
3.31
Immigrants | Bolivia
99.6
/100
|
#88
Exceptional
3.31
Malaysians
99.6
/100
|
#89
Exceptional
3.31
Menominee
99.4
/100
|
#90
Exceptional
3.30
Immigrants | Pakistan
99.2
/100
|
#91
Exceptional
3.30
Immigrants | Cameroon
99.2
/100
|
#92
Exceptional
3.30
Peruvians
99.2
/100
|
#93
Exceptional
3.30