Burmese vs Immigrants from Sudan Average Family Size
COMPARE
Burmese
Immigrants from Sudan
Average Family Size
Average Family Size Comparison
Burmese
Immigrants from Sudan
3.22
AVERAGE FAMILY SIZE
31.0/ 100
METRIC RATING
190th/ 347
METRIC RANK
3.22
AVERAGE FAMILY SIZE
29.1/ 100
METRIC RATING
194th/ 347
METRIC RANK
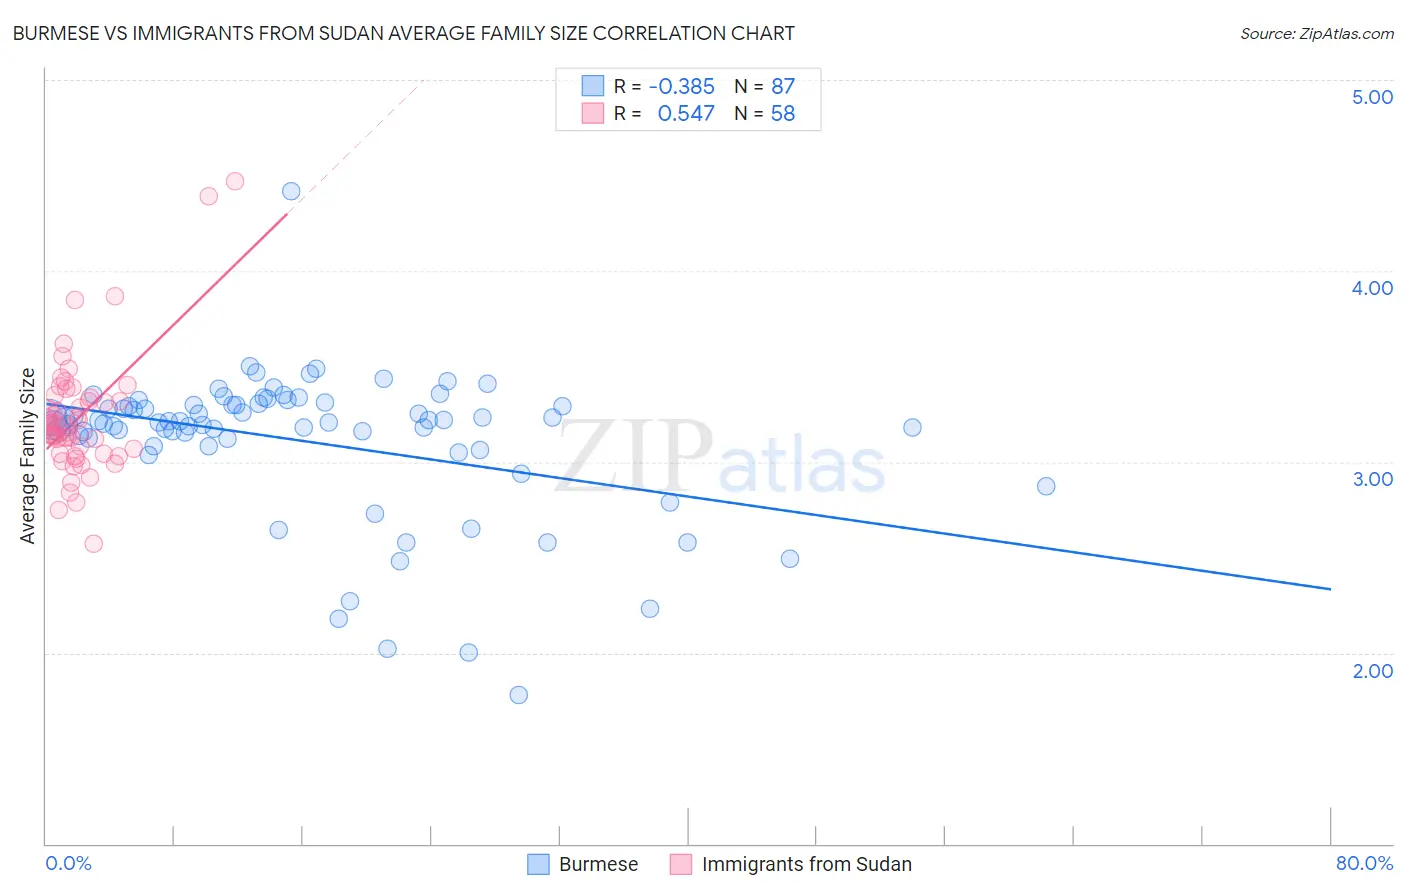
Burmese vs Immigrants from Sudan Average Family Size Correlation Chart
The statistical analysis conducted on geographies consisting of 464,897,225 people shows a mild negative correlation between the proportion of Burmese and average family size in the United States with a correlation coefficient (R) of -0.385 and weighted average of 3.22. Similarly, the statistical analysis conducted on geographies consisting of 118,946,972 people shows a substantial positive correlation between the proportion of Immigrants from Sudan and average family size in the United States with a correlation coefficient (R) of 0.547 and weighted average of 3.22, a difference of 0.040%.
Average Family Size Correlation Summary
| Measurement | Burmese | Immigrants from Sudan |
| Minimum | 1.78 | 2.57 |
| Maximum | 4.42 | 4.47 |
| Range | 2.64 | 1.90 |
| Mean | 3.11 | 3.23 |
| Median | 3.21 | 3.18 |
| Interquartile 25% (IQ1) | 3.08 | 3.04 |
| Interquartile 75% (IQ3) | 3.30 | 3.34 |
| Interquartile Range (IQR) | 0.22 | 0.30 |
| Standard Deviation (Sample) | 0.39 | 0.33 |
| Standard Deviation (Population) | 0.38 | 0.32 |
Demographics Similar to Burmese and Immigrants from Sudan by Average Family Size
In terms of average family size, the demographic groups most similar to Burmese are Immigrants from Zaire (3.22, a difference of 0.010%), Immigrants from Eastern Africa (3.22, a difference of 0.020%), Immigrants from Israel (3.22, a difference of 0.040%), Pakistani (3.22, a difference of 0.060%), and Choctaw (3.21, a difference of 0.060%). Similarly, the demographic groups most similar to Immigrants from Sudan are Immigrants from Israel (3.22, a difference of 0.0%), Immigrants from Eastern Africa (3.22, a difference of 0.020%), Choctaw (3.21, a difference of 0.020%), Senegalese (3.21, a difference of 0.020%), and Kenyan (3.21, a difference of 0.020%).
| Demographics | Rating | Rank | Average Family Size |
| Moroccans | 44.2 /100 | #182 | Average 3.22 |
| Immigrants | Northern Africa | 41.7 /100 | #183 | Average 3.22 |
| Immigrants | Eastern Asia | 40.8 /100 | #184 | Average 3.22 |
| Immigrants | Sri Lanka | 39.8 /100 | #185 | Fair 3.22 |
| Immigrants | Argentina | 39.8 /100 | #186 | Fair 3.22 |
| Immigrants | Malaysia | 39.0 /100 | #187 | Fair 3.22 |
| Thais | 38.3 /100 | #188 | Fair 3.22 |
| Pakistanis | 33.7 /100 | #189 | Fair 3.22 |
| Burmese | 31.0 /100 | #190 | Fair 3.22 |
| Immigrants | Zaire | 30.5 /100 | #191 | Fair 3.22 |
| Immigrants | Eastern Africa | 30.1 /100 | #192 | Fair 3.22 |
| Immigrants | Israel | 29.3 /100 | #193 | Fair 3.22 |
| Immigrants | Sudan | 29.1 /100 | #194 | Fair 3.22 |
| Choctaw | 28.3 /100 | #195 | Fair 3.21 |
| Senegalese | 28.2 /100 | #196 | Fair 3.21 |
| Kenyans | 28.0 /100 | #197 | Fair 3.21 |
| Immigrants | Azores | 21.7 /100 | #198 | Fair 3.21 |
| Hmong | 20.7 /100 | #199 | Fair 3.21 |
| Immigrants | Kenya | 19.2 /100 | #200 | Poor 3.21 |
| Immigrants | Morocco | 18.5 /100 | #201 | Poor 3.21 |
| Immigrants | India | 18.5 /100 | #202 | Poor 3.21 |