White/Caucasian vs Immigrants from Venezuela Divorced or Separated
COMPARE
White/Caucasian
Immigrants from Venezuela
Divorced or Separated
Divorced or Separated Comparison
Whites/Caucasians
Immigrants from Venezuela
12.6%
DIVORCED OR SEPARATED
0.5/ 100
METRIC RATING
266th/ 347
METRIC RANK
13.1%
DIVORCED OR SEPARATED
0.0/ 100
METRIC RATING
302nd/ 347
METRIC RANK
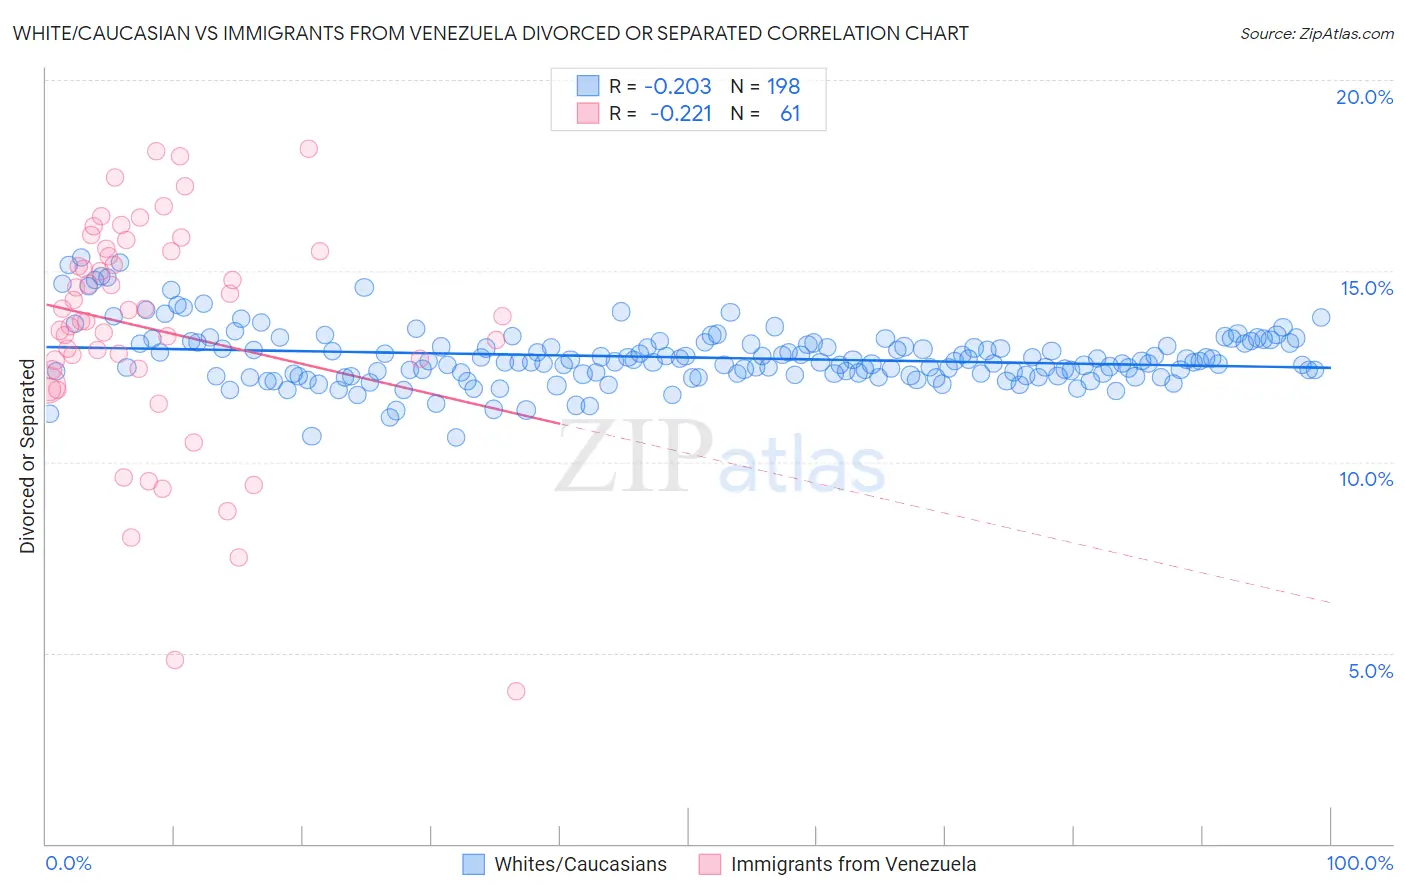
White/Caucasian vs Immigrants from Venezuela Divorced or Separated Correlation Chart
The statistical analysis conducted on geographies consisting of 582,391,050 people shows a weak negative correlation between the proportion of Whites/Caucasians and percentage of population currently divorced or separated in the United States with a correlation coefficient (R) of -0.203 and weighted average of 12.6%. Similarly, the statistical analysis conducted on geographies consisting of 287,802,999 people shows a weak negative correlation between the proportion of Immigrants from Venezuela and percentage of population currently divorced or separated in the United States with a correlation coefficient (R) of -0.221 and weighted average of 13.1%, a difference of 4.1%.
Divorced or Separated Correlation Summary
| Measurement | White/Caucasian | Immigrants from Venezuela |
| Minimum | 10.6% | 4.0% |
| Maximum | 15.4% | 18.2% |
| Range | 4.7% | 14.2% |
| Mean | 12.7% | 13.5% |
| Median | 12.6% | 13.8% |
| Interquartile 25% (IQ1) | 12.3% | 12.4% |
| Interquartile 75% (IQ3) | 13.1% | 15.5% |
| Interquartile Range (IQR) | 0.82% | 3.1% |
| Standard Deviation (Sample) | 0.77% | 3.0% |
| Standard Deviation (Population) | 0.77% | 3.0% |
Similar Demographics by Divorced or Separated
Demographics Similar to Whites/Caucasians by Divorced or Separated
In terms of divorced or separated, the demographic groups most similar to Whites/Caucasians are Immigrants from Senegal (12.6%, a difference of 0.010%), English (12.6%, a difference of 0.030%), Scottish (12.6%, a difference of 0.040%), Immigrants from Panama (12.6%, a difference of 0.050%), and Fijian (12.6%, a difference of 0.060%).
| Demographics | Rating | Rank | Divorced or Separated |
| Yuman | 0.6 /100 | #259 | Tragic 12.6% |
| Immigrants | Uruguay | 0.6 /100 | #260 | Tragic 12.6% |
| Immigrants | Dominica | 0.5 /100 | #261 | Tragic 12.6% |
| Basques | 0.5 /100 | #262 | Tragic 12.6% |
| Immigrants | Panama | 0.5 /100 | #263 | Tragic 12.6% |
| English | 0.5 /100 | #264 | Tragic 12.6% |
| Immigrants | Senegal | 0.5 /100 | #265 | Tragic 12.6% |
| Whites/Caucasians | 0.5 /100 | #266 | Tragic 12.6% |
| Scottish | 0.4 /100 | #267 | Tragic 12.6% |
| Fijians | 0.4 /100 | #268 | Tragic 12.6% |
| Immigrants | Liberia | 0.4 /100 | #269 | Tragic 12.6% |
| Ute | 0.4 /100 | #270 | Tragic 12.6% |
| Panamanians | 0.3 /100 | #271 | Tragic 12.7% |
| Immigrants | Middle Africa | 0.3 /100 | #272 | Tragic 12.7% |
| Immigrants | Micronesia | 0.3 /100 | #273 | Tragic 12.7% |
Demographics Similar to Immigrants from Venezuela by Divorced or Separated
In terms of divorced or separated, the demographic groups most similar to Immigrants from Venezuela are Cape Verdean (13.1%, a difference of 0.020%), Alaskan Athabascan (13.1%, a difference of 0.10%), Hopi (13.2%, a difference of 0.15%), Chippewa (13.2%, a difference of 0.20%), and Immigrants from Cabo Verde (13.1%, a difference of 0.31%).
| Demographics | Rating | Rank | Divorced or Separated |
| Celtics | 0.0 /100 | #295 | Tragic 13.0% |
| Nicaraguans | 0.0 /100 | #296 | Tragic 13.0% |
| Natives/Alaskans | 0.0 /100 | #297 | Tragic 13.0% |
| Venezuelans | 0.0 /100 | #298 | Tragic 13.0% |
| Immigrants | Jamaica | 0.0 /100 | #299 | Tragic 13.0% |
| Immigrants | Cabo Verde | 0.0 /100 | #300 | Tragic 13.1% |
| Alaskan Athabascans | 0.0 /100 | #301 | Tragic 13.1% |
| Immigrants | Venezuela | 0.0 /100 | #302 | Tragic 13.1% |
| Cape Verdeans | 0.0 /100 | #303 | Tragic 13.1% |
| Hopi | 0.0 /100 | #304 | Tragic 13.2% |
| Chippewa | 0.0 /100 | #305 | Tragic 13.2% |
| Tlingit-Haida | 0.0 /100 | #306 | Tragic 13.2% |
| French American Indians | 0.0 /100 | #307 | Tragic 13.2% |
| Ottawa | 0.0 /100 | #308 | Tragic 13.2% |
| Americans | 0.0 /100 | #309 | Tragic 13.2% |