White/Caucasian vs Israeli Divorced or Separated
COMPARE
White/Caucasian
Israeli
Divorced or Separated
Divorced or Separated Comparison
Whites/Caucasians
Israelis
12.6%
DIVORCED OR SEPARATED
0.5/ 100
METRIC RATING
266th/ 347
METRIC RANK
11.3%
DIVORCED OR SEPARATED
99.9/ 100
METRIC RATING
59th/ 347
METRIC RANK
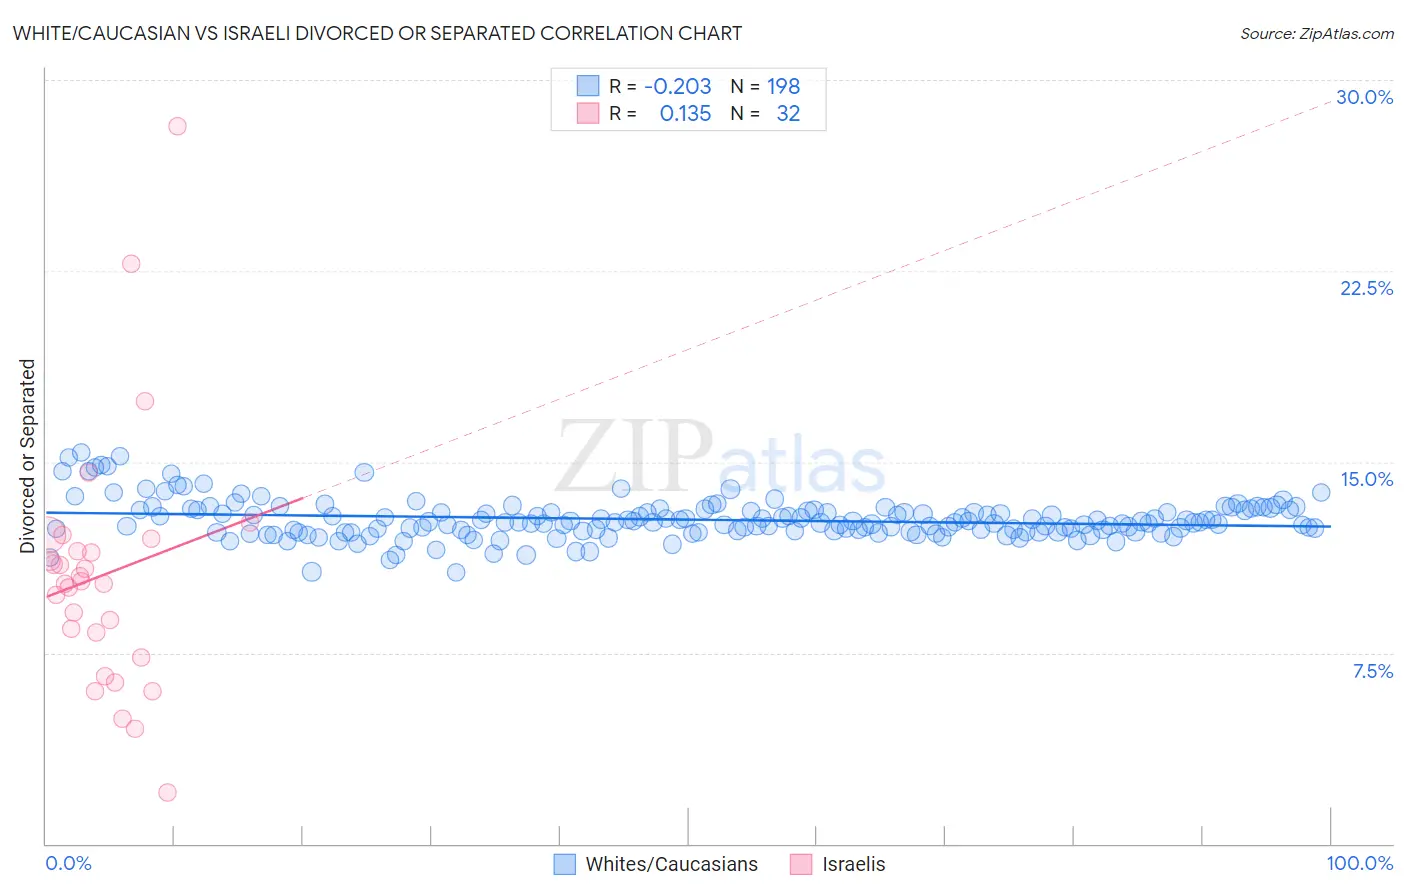
White/Caucasian vs Israeli Divorced or Separated Correlation Chart
The statistical analysis conducted on geographies consisting of 582,391,050 people shows a weak negative correlation between the proportion of Whites/Caucasians and percentage of population currently divorced or separated in the United States with a correlation coefficient (R) of -0.203 and weighted average of 12.6%. Similarly, the statistical analysis conducted on geographies consisting of 211,065,028 people shows a poor positive correlation between the proportion of Israelis and percentage of population currently divorced or separated in the United States with a correlation coefficient (R) of 0.135 and weighted average of 11.3%, a difference of 11.4%.
Divorced or Separated Correlation Summary
| Measurement | White/Caucasian | Israeli |
| Minimum | 10.6% | 2.0% |
| Maximum | 15.4% | 28.2% |
| Range | 4.7% | 26.2% |
| Mean | 12.7% | 10.6% |
| Median | 12.6% | 10.3% |
| Interquartile 25% (IQ1) | 12.3% | 7.8% |
| Interquartile 75% (IQ3) | 13.1% | 11.8% |
| Interquartile Range (IQR) | 0.82% | 3.9% |
| Standard Deviation (Sample) | 0.77% | 5.0% |
| Standard Deviation (Population) | 0.77% | 4.9% |
Similar Demographics by Divorced or Separated
Demographics Similar to Whites/Caucasians by Divorced or Separated
In terms of divorced or separated, the demographic groups most similar to Whites/Caucasians are Immigrants from Senegal (12.6%, a difference of 0.010%), English (12.6%, a difference of 0.030%), Scottish (12.6%, a difference of 0.040%), Immigrants from Panama (12.6%, a difference of 0.050%), and Fijian (12.6%, a difference of 0.060%).
| Demographics | Rating | Rank | Divorced or Separated |
| Yuman | 0.6 /100 | #259 | Tragic 12.6% |
| Immigrants | Uruguay | 0.6 /100 | #260 | Tragic 12.6% |
| Immigrants | Dominica | 0.5 /100 | #261 | Tragic 12.6% |
| Basques | 0.5 /100 | #262 | Tragic 12.6% |
| Immigrants | Panama | 0.5 /100 | #263 | Tragic 12.6% |
| English | 0.5 /100 | #264 | Tragic 12.6% |
| Immigrants | Senegal | 0.5 /100 | #265 | Tragic 12.6% |
| Whites/Caucasians | 0.5 /100 | #266 | Tragic 12.6% |
| Scottish | 0.4 /100 | #267 | Tragic 12.6% |
| Fijians | 0.4 /100 | #268 | Tragic 12.6% |
| Immigrants | Liberia | 0.4 /100 | #269 | Tragic 12.6% |
| Ute | 0.4 /100 | #270 | Tragic 12.6% |
| Panamanians | 0.3 /100 | #271 | Tragic 12.7% |
| Immigrants | Middle Africa | 0.3 /100 | #272 | Tragic 12.7% |
| Immigrants | Micronesia | 0.3 /100 | #273 | Tragic 12.7% |
Demographics Similar to Israelis by Divorced or Separated
In terms of divorced or separated, the demographic groups most similar to Israelis are Sri Lankan (11.3%, a difference of 0.10%), Immigrants from Vietnam (11.3%, a difference of 0.16%), Immigrants from Russia (11.3%, a difference of 0.16%), Immigrants from Philippines (11.3%, a difference of 0.17%), and Korean (11.3%, a difference of 0.17%).
| Demographics | Rating | Rank | Divorced or Separated |
| Immigrants | Australia | 99.9 /100 | #52 | Exceptional 11.3% |
| Immigrants | Lithuania | 99.9 /100 | #53 | Exceptional 11.3% |
| Eastern Europeans | 99.9 /100 | #54 | Exceptional 11.3% |
| Immigrants | Yemen | 99.9 /100 | #55 | Exceptional 11.3% |
| Immigrants | Philippines | 99.9 /100 | #56 | Exceptional 11.3% |
| Immigrants | Vietnam | 99.9 /100 | #57 | Exceptional 11.3% |
| Sri Lankans | 99.9 /100 | #58 | Exceptional 11.3% |
| Israelis | 99.9 /100 | #59 | Exceptional 11.3% |
| Immigrants | Russia | 99.9 /100 | #60 | Exceptional 11.3% |
| Koreans | 99.9 /100 | #61 | Exceptional 11.3% |
| Luxembourgers | 99.9 /100 | #62 | Exceptional 11.3% |
| Immigrants | Kuwait | 99.9 /100 | #63 | Exceptional 11.3% |
| Macedonians | 99.8 /100 | #64 | Exceptional 11.4% |
| Immigrants | South Eastern Asia | 99.8 /100 | #65 | Exceptional 11.4% |
| Inupiat | 99.8 /100 | #66 | Exceptional 11.4% |