White/Caucasian vs U.S. Virgin Islander Divorced or Separated
COMPARE
White/Caucasian
U.S. Virgin Islander
Divorced or Separated
Divorced or Separated Comparison
Whites/Caucasians
U.S. Virgin Islanders
12.6%
DIVORCED OR SEPARATED
0.5/ 100
METRIC RATING
266th/ 347
METRIC RANK
13.4%
DIVORCED OR SEPARATED
0.0/ 100
METRIC RATING
323rd/ 347
METRIC RANK
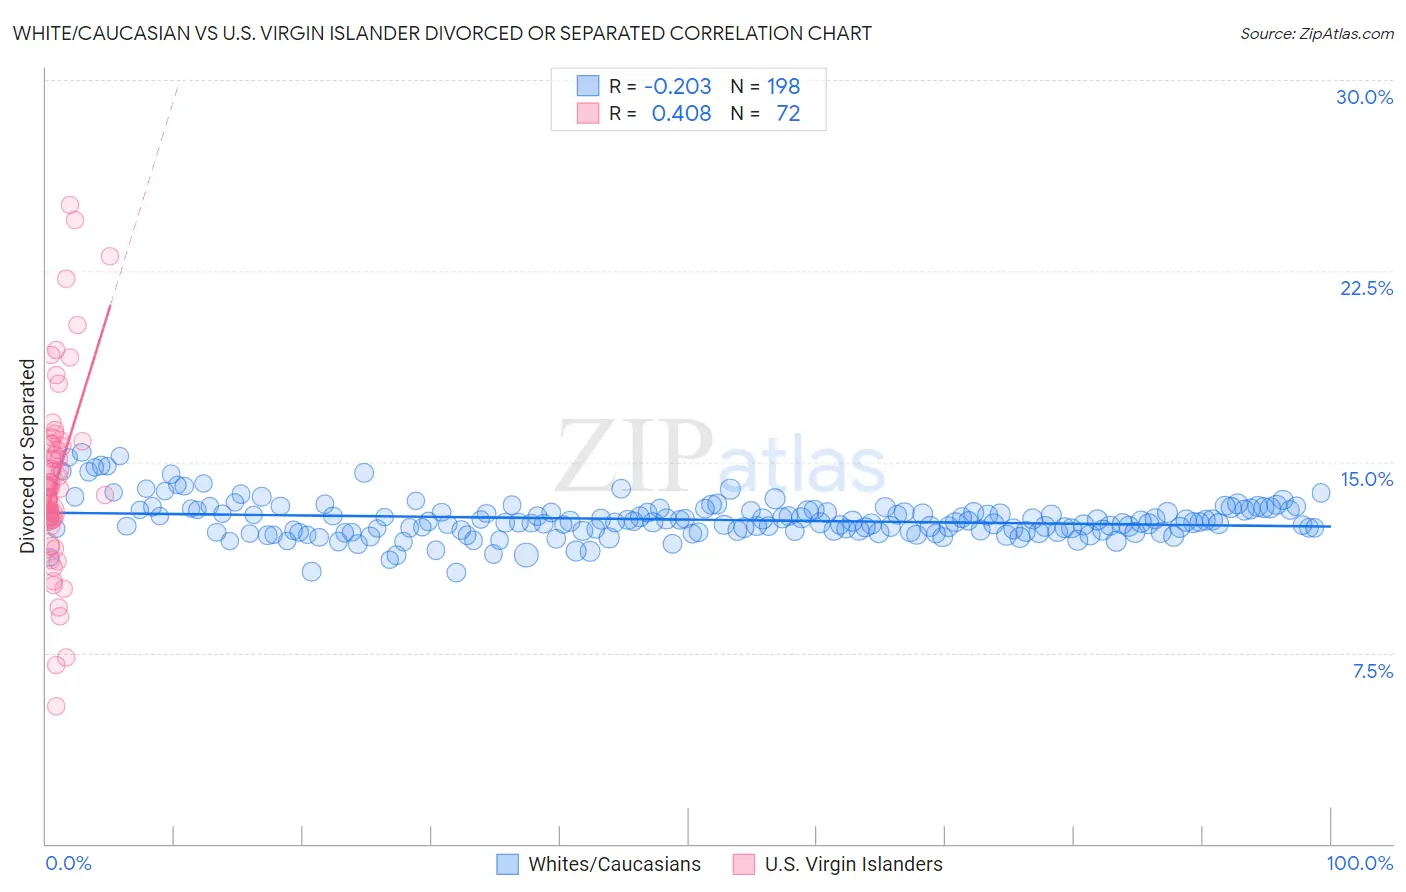
White/Caucasian vs U.S. Virgin Islander Divorced or Separated Correlation Chart
The statistical analysis conducted on geographies consisting of 582,391,050 people shows a weak negative correlation between the proportion of Whites/Caucasians and percentage of population currently divorced or separated in the United States with a correlation coefficient (R) of -0.203 and weighted average of 12.6%. Similarly, the statistical analysis conducted on geographies consisting of 87,523,386 people shows a moderate positive correlation between the proportion of U.S. Virgin Islanders and percentage of population currently divorced or separated in the United States with a correlation coefficient (R) of 0.408 and weighted average of 13.4%, a difference of 6.5%.
Divorced or Separated Correlation Summary
| Measurement | White/Caucasian | U.S. Virgin Islander |
| Minimum | 10.6% | 5.4% |
| Maximum | 15.4% | 25.1% |
| Range | 4.7% | 19.7% |
| Mean | 12.7% | 14.2% |
| Median | 12.6% | 14.0% |
| Interquartile 25% (IQ1) | 12.3% | 12.8% |
| Interquartile 75% (IQ3) | 13.1% | 15.7% |
| Interquartile Range (IQR) | 0.82% | 2.9% |
| Standard Deviation (Sample) | 0.77% | 3.6% |
| Standard Deviation (Population) | 0.77% | 3.5% |
Similar Demographics by Divorced or Separated
Demographics Similar to Whites/Caucasians by Divorced or Separated
In terms of divorced or separated, the demographic groups most similar to Whites/Caucasians are Immigrants from Senegal (12.6%, a difference of 0.010%), English (12.6%, a difference of 0.030%), Scottish (12.6%, a difference of 0.040%), Immigrants from Panama (12.6%, a difference of 0.050%), and Fijian (12.6%, a difference of 0.060%).
| Demographics | Rating | Rank | Divorced or Separated |
| Yuman | 0.6 /100 | #259 | Tragic 12.6% |
| Immigrants | Uruguay | 0.6 /100 | #260 | Tragic 12.6% |
| Immigrants | Dominica | 0.5 /100 | #261 | Tragic 12.6% |
| Basques | 0.5 /100 | #262 | Tragic 12.6% |
| Immigrants | Panama | 0.5 /100 | #263 | Tragic 12.6% |
| English | 0.5 /100 | #264 | Tragic 12.6% |
| Immigrants | Senegal | 0.5 /100 | #265 | Tragic 12.6% |
| Whites/Caucasians | 0.5 /100 | #266 | Tragic 12.6% |
| Scottish | 0.4 /100 | #267 | Tragic 12.6% |
| Fijians | 0.4 /100 | #268 | Tragic 12.6% |
| Immigrants | Liberia | 0.4 /100 | #269 | Tragic 12.6% |
| Ute | 0.4 /100 | #270 | Tragic 12.6% |
| Panamanians | 0.3 /100 | #271 | Tragic 12.7% |
| Immigrants | Middle Africa | 0.3 /100 | #272 | Tragic 12.7% |
| Immigrants | Micronesia | 0.3 /100 | #273 | Tragic 12.7% |
Demographics Similar to U.S. Virgin Islanders by Divorced or Separated
In terms of divorced or separated, the demographic groups most similar to U.S. Virgin Islanders are Osage (13.4%, a difference of 0.070%), Potawatomi (13.5%, a difference of 0.13%), Immigrants from Congo (13.5%, a difference of 0.14%), Immigrants from Haiti (13.4%, a difference of 0.22%), and Cheyenne (13.4%, a difference of 0.46%).
| Demographics | Rating | Rank | Divorced or Separated |
| Tsimshian | 0.0 /100 | #316 | Tragic 13.3% |
| Haitians | 0.0 /100 | #317 | Tragic 13.3% |
| Cree | 0.0 /100 | #318 | Tragic 13.4% |
| Puget Sound Salish | 0.0 /100 | #319 | Tragic 13.4% |
| Cajuns | 0.0 /100 | #320 | Tragic 13.4% |
| Cheyenne | 0.0 /100 | #321 | Tragic 13.4% |
| Immigrants | Haiti | 0.0 /100 | #322 | Tragic 13.4% |
| U.S. Virgin Islanders | 0.0 /100 | #323 | Tragic 13.4% |
| Osage | 0.0 /100 | #324 | Tragic 13.4% |
| Potawatomi | 0.0 /100 | #325 | Tragic 13.5% |
| Immigrants | Congo | 0.0 /100 | #326 | Tragic 13.5% |
| Comanche | 0.0 /100 | #327 | Tragic 13.5% |
| Immigrants | Caribbean | 0.0 /100 | #328 | Tragic 13.6% |
| Houma | 0.0 /100 | #329 | Tragic 13.6% |
| Paiute | 0.0 /100 | #330 | Tragic 13.6% |