White/Caucasian vs European Bachelor's Degree
COMPARE
White/Caucasian
European
Bachelor's Degree
Bachelor's Degree Comparison
Whites/Caucasians
Europeans
35.3%
BACHELOR'S DEGREE
5.9/ 100
METRIC RATING
229th/ 347
METRIC RANK
39.5%
BACHELOR'S DEGREE
85.6/ 100
METRIC RATING
138th/ 347
METRIC RANK
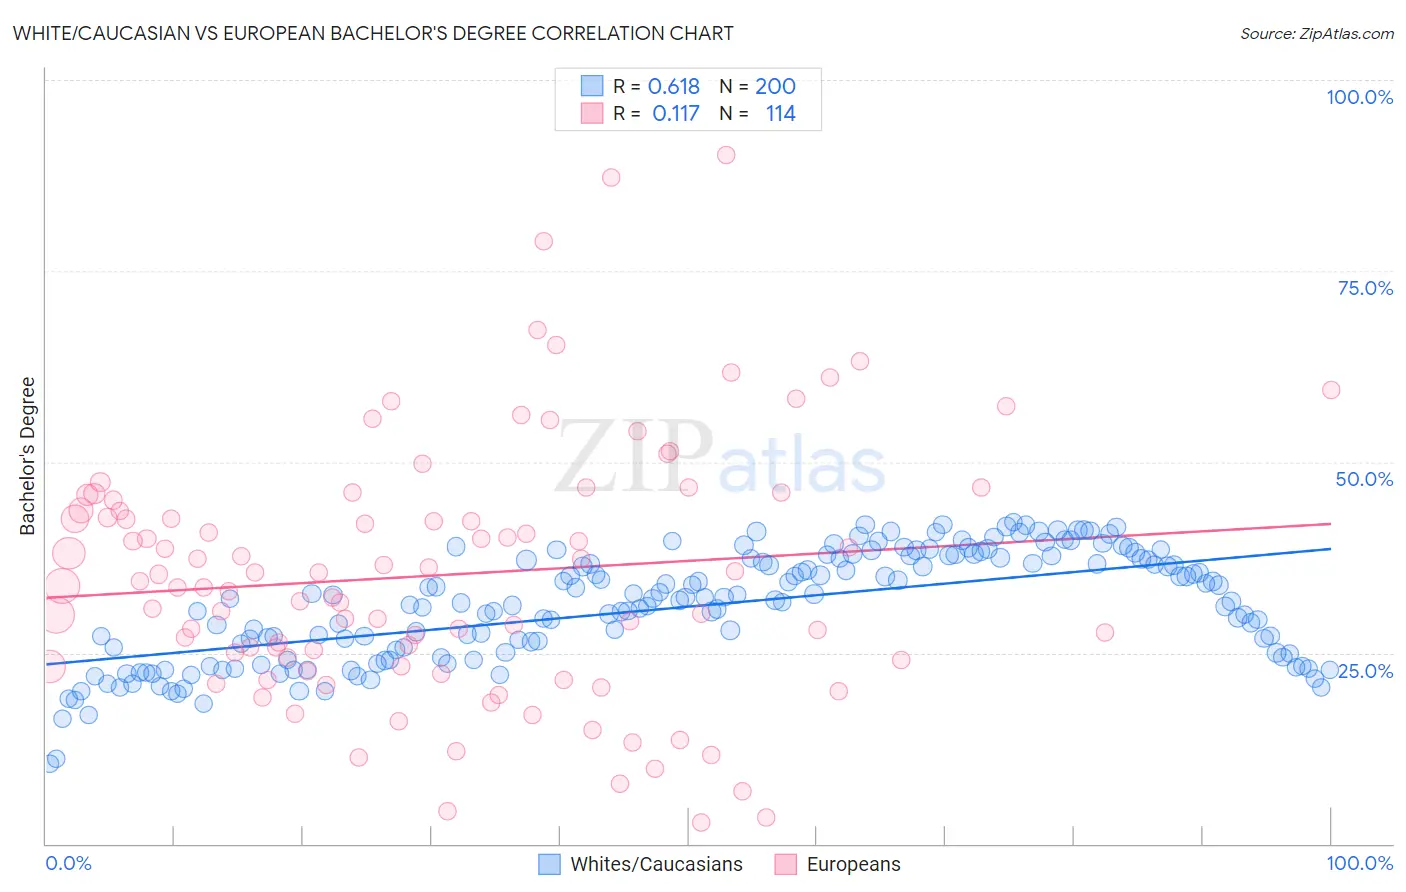
White/Caucasian vs European Bachelor's Degree Correlation Chart
The statistical analysis conducted on geographies consisting of 584,716,229 people shows a significant positive correlation between the proportion of Whites/Caucasians and percentage of population with at least bachelor's degree education in the United States with a correlation coefficient (R) of 0.618 and weighted average of 35.3%. Similarly, the statistical analysis conducted on geographies consisting of 561,699,740 people shows a poor positive correlation between the proportion of Europeans and percentage of population with at least bachelor's degree education in the United States with a correlation coefficient (R) of 0.117 and weighted average of 39.5%, a difference of 11.9%.
Bachelor's Degree Correlation Summary
| Measurement | White/Caucasian | European |
| Minimum | 10.4% | 2.8% |
| Maximum | 42.1% | 90.2% |
| Range | 31.7% | 87.4% |
| Mean | 31.0% | 35.2% |
| Median | 31.9% | 34.1% |
| Interquartile 25% (IQ1) | 24.9% | 24.1% |
| Interquartile 75% (IQ3) | 37.3% | 43.7% |
| Interquartile Range (IQR) | 12.4% | 19.5% |
| Standard Deviation (Sample) | 7.1% | 16.6% |
| Standard Deviation (Population) | 7.1% | 16.6% |
Similar Demographics by Bachelor's Degree
Demographics Similar to Whites/Caucasians by Bachelor's Degree
In terms of bachelor's degree, the demographic groups most similar to Whites/Caucasians are Immigrants from Trinidad and Tobago (35.3%, a difference of 0.080%), Ecuadorian (35.4%, a difference of 0.31%), Portuguese (35.5%, a difference of 0.57%), Immigrants from Burma/Myanmar (35.5%, a difference of 0.61%), and Immigrants from Barbados (35.5%, a difference of 0.68%).
| Demographics | Rating | Rank | Bachelor's Degree |
| Trinidadians and Tobagonians | 8.8 /100 | #222 | Tragic 35.7% |
| French Canadians | 8.3 /100 | #223 | Tragic 35.6% |
| Immigrants | Barbados | 7.5 /100 | #224 | Tragic 35.5% |
| Immigrants | Burma/Myanmar | 7.3 /100 | #225 | Tragic 35.5% |
| Portuguese | 7.2 /100 | #226 | Tragic 35.5% |
| Ecuadorians | 6.6 /100 | #227 | Tragic 35.4% |
| Immigrants | Trinidad and Tobago | 6.0 /100 | #228 | Tragic 35.3% |
| Whites/Caucasians | 5.9 /100 | #229 | Tragic 35.3% |
| Immigrants | Grenada | 4.3 /100 | #230 | Tragic 35.0% |
| Immigrants | St. Vincent and the Grenadines | 4.3 /100 | #231 | Tragic 35.0% |
| Hmong | 3.4 /100 | #232 | Tragic 34.8% |
| Immigrants | Ecuador | 3.3 /100 | #233 | Tragic 34.7% |
| Guamanians/Chamorros | 3.0 /100 | #234 | Tragic 34.6% |
| Immigrants | West Indies | 2.9 /100 | #235 | Tragic 34.6% |
| Liberians | 2.8 /100 | #236 | Tragic 34.6% |
Demographics Similar to Europeans by Bachelor's Degree
In terms of bachelor's degree, the demographic groups most similar to Europeans are Icelander (39.5%, a difference of 0.17%), Immigrants from Sudan (39.4%, a difference of 0.20%), Immigrants from Armenia (39.4%, a difference of 0.27%), South American Indian (39.3%, a difference of 0.35%), and Pakistani (39.7%, a difference of 0.54%).
| Demographics | Rating | Rank | Bachelor's Degree |
| Italians | 91.9 /100 | #131 | Exceptional 40.1% |
| Taiwanese | 91.1 /100 | #132 | Exceptional 40.0% |
| Immigrants | Southern Europe | 91.1 /100 | #133 | Exceptional 40.0% |
| Assyrians/Chaldeans/Syriacs | 89.4 /100 | #134 | Excellent 39.8% |
| Luxembourgers | 89.1 /100 | #135 | Excellent 39.8% |
| Pakistanis | 88.2 /100 | #136 | Excellent 39.7% |
| Icelanders | 86.5 /100 | #137 | Excellent 39.5% |
| Europeans | 85.6 /100 | #138 | Excellent 39.5% |
| Immigrants | Sudan | 84.5 /100 | #139 | Excellent 39.4% |
| Immigrants | Armenia | 84.1 /100 | #140 | Excellent 39.4% |
| South American Indians | 83.6 /100 | #141 | Excellent 39.3% |
| Immigrants | North Macedonia | 81.6 /100 | #142 | Excellent 39.2% |
| Poles | 79.8 /100 | #143 | Good 39.1% |
| Immigrants | Afghanistan | 79.7 /100 | #144 | Good 39.1% |
| Slovenes | 79.5 /100 | #145 | Good 39.1% |