White/Caucasian vs Immigrants from Bangladesh Divorced or Separated
COMPARE
White/Caucasian
Immigrants from Bangladesh
Divorced or Separated
Divorced or Separated Comparison
Whites/Caucasians
Immigrants from Bangladesh
12.6%
DIVORCED OR SEPARATED
0.5/ 100
METRIC RATING
266th/ 347
METRIC RANK
11.0%
DIVORCED OR SEPARATED
100.0/ 100
METRIC RATING
27th/ 347
METRIC RANK
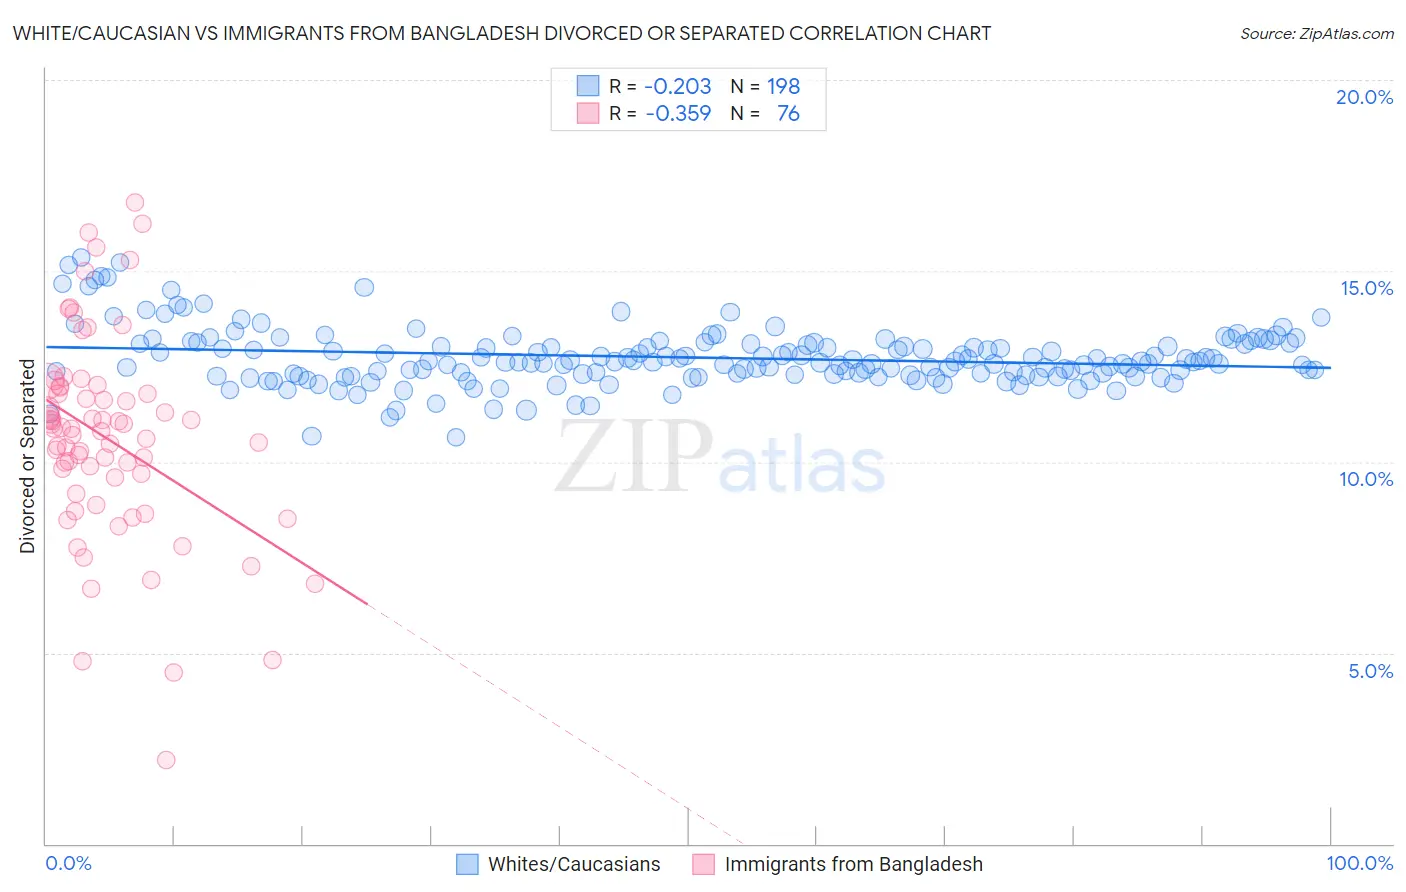
White/Caucasian vs Immigrants from Bangladesh Divorced or Separated Correlation Chart
The statistical analysis conducted on geographies consisting of 582,391,050 people shows a weak negative correlation between the proportion of Whites/Caucasians and percentage of population currently divorced or separated in the United States with a correlation coefficient (R) of -0.203 and weighted average of 12.6%. Similarly, the statistical analysis conducted on geographies consisting of 203,592,218 people shows a mild negative correlation between the proportion of Immigrants from Bangladesh and percentage of population currently divorced or separated in the United States with a correlation coefficient (R) of -0.359 and weighted average of 11.0%, a difference of 15.1%.
Divorced or Separated Correlation Summary
| Measurement | White/Caucasian | Immigrants from Bangladesh |
| Minimum | 10.6% | 2.2% |
| Maximum | 15.4% | 16.8% |
| Range | 4.7% | 14.6% |
| Mean | 12.7% | 10.6% |
| Median | 12.6% | 10.8% |
| Interquartile 25% (IQ1) | 12.3% | 9.4% |
| Interquartile 75% (IQ3) | 13.1% | 11.9% |
| Interquartile Range (IQR) | 0.82% | 2.5% |
| Standard Deviation (Sample) | 0.77% | 2.7% |
| Standard Deviation (Population) | 0.77% | 2.7% |
Similar Demographics by Divorced or Separated
Demographics Similar to Whites/Caucasians by Divorced or Separated
In terms of divorced or separated, the demographic groups most similar to Whites/Caucasians are Immigrants from Senegal (12.6%, a difference of 0.010%), English (12.6%, a difference of 0.030%), Scottish (12.6%, a difference of 0.040%), Immigrants from Panama (12.6%, a difference of 0.050%), and Fijian (12.6%, a difference of 0.060%).
| Demographics | Rating | Rank | Divorced or Separated |
| Yuman | 0.6 /100 | #259 | Tragic 12.6% |
| Immigrants | Uruguay | 0.6 /100 | #260 | Tragic 12.6% |
| Immigrants | Dominica | 0.5 /100 | #261 | Tragic 12.6% |
| Basques | 0.5 /100 | #262 | Tragic 12.6% |
| Immigrants | Panama | 0.5 /100 | #263 | Tragic 12.6% |
| English | 0.5 /100 | #264 | Tragic 12.6% |
| Immigrants | Senegal | 0.5 /100 | #265 | Tragic 12.6% |
| Whites/Caucasians | 0.5 /100 | #266 | Tragic 12.6% |
| Scottish | 0.4 /100 | #267 | Tragic 12.6% |
| Fijians | 0.4 /100 | #268 | Tragic 12.6% |
| Immigrants | Liberia | 0.4 /100 | #269 | Tragic 12.6% |
| Ute | 0.4 /100 | #270 | Tragic 12.6% |
| Panamanians | 0.3 /100 | #271 | Tragic 12.7% |
| Immigrants | Middle Africa | 0.3 /100 | #272 | Tragic 12.7% |
| Immigrants | Micronesia | 0.3 /100 | #273 | Tragic 12.7% |
Demographics Similar to Immigrants from Bangladesh by Divorced or Separated
In terms of divorced or separated, the demographic groups most similar to Immigrants from Bangladesh are Immigrants from Malaysia (11.0%, a difference of 0.030%), Armenian (11.0%, a difference of 0.10%), Immigrants from Indonesia (10.9%, a difference of 0.44%), Immigrants from Ireland (11.0%, a difference of 0.62%), and Mongolian (11.1%, a difference of 0.92%).
| Demographics | Rating | Rank | Divorced or Separated |
| Burmese | 100.0 /100 | #20 | Exceptional 10.7% |
| Immigrants | Asia | 100.0 /100 | #21 | Exceptional 10.7% |
| Vietnamese | 100.0 /100 | #22 | Exceptional 10.8% |
| Immigrants | Pakistan | 100.0 /100 | #23 | Exceptional 10.8% |
| Immigrants | Sri Lanka | 100.0 /100 | #24 | Exceptional 10.8% |
| Iranians | 100.0 /100 | #25 | Exceptional 10.8% |
| Immigrants | Indonesia | 100.0 /100 | #26 | Exceptional 10.9% |
| Immigrants | Bangladesh | 100.0 /100 | #27 | Exceptional 11.0% |
| Immigrants | Malaysia | 100.0 /100 | #28 | Exceptional 11.0% |
| Armenians | 100.0 /100 | #29 | Exceptional 11.0% |
| Immigrants | Ireland | 100.0 /100 | #30 | Exceptional 11.0% |
| Mongolians | 100.0 /100 | #31 | Exceptional 11.1% |
| Tongans | 100.0 /100 | #32 | Exceptional 11.1% |
| Egyptians | 100.0 /100 | #33 | Exceptional 11.1% |
| Immigrants | Uzbekistan | 100.0 /100 | #34 | Exceptional 11.1% |