Uruguayan vs Subsaharan African Births to Unmarried Women
COMPARE
Uruguayan
Subsaharan African
Births to Unmarried Women
Births to Unmarried Women Comparison
Uruguayans
Sub-Saharan Africans
33.1%
BIRTHS TO UNMARRIED WOMEN
12.8/ 100
METRIC RATING
206th/ 347
METRIC RANK
36.7%
BIRTHS TO UNMARRIED WOMEN
0.1/ 100
METRIC RATING
264th/ 347
METRIC RANK
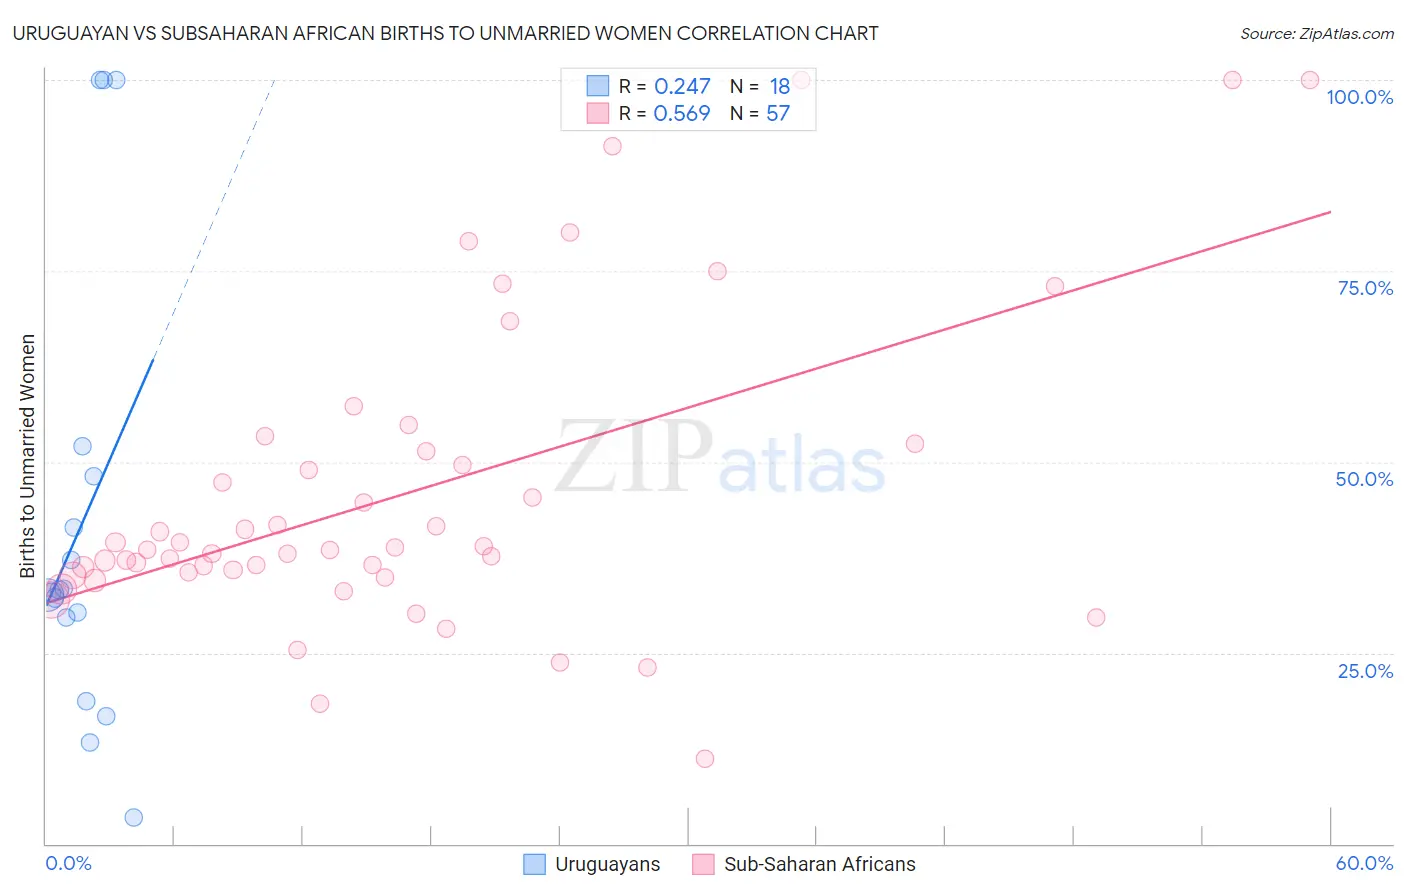
Uruguayan vs Subsaharan African Births to Unmarried Women Correlation Chart
The statistical analysis conducted on geographies consisting of 140,023,012 people shows a weak positive correlation between the proportion of Uruguayans and percentage of births to unmarried women in the United States with a correlation coefficient (R) of 0.247 and weighted average of 33.1%. Similarly, the statistical analysis conducted on geographies consisting of 468,897,335 people shows a substantial positive correlation between the proportion of Sub-Saharan Africans and percentage of births to unmarried women in the United States with a correlation coefficient (R) of 0.569 and weighted average of 36.7%, a difference of 10.7%.
Births to Unmarried Women Correlation Summary
| Measurement | Uruguayan | Subsaharan African |
| Minimum | 3.4% | 11.1% |
| Maximum | 100.0% | 100.0% |
| Range | 96.6% | 88.9% |
| Mean | 41.9% | 45.9% |
| Median | 33.1% | 38.5% |
| Interquartile 25% (IQ1) | 29.6% | 35.3% |
| Interquartile 75% (IQ3) | 48.1% | 51.9% |
| Interquartile Range (IQR) | 18.5% | 16.5% |
| Standard Deviation (Sample) | 29.2% | 20.2% |
| Standard Deviation (Population) | 28.3% | 20.0% |
Similar Demographics by Births to Unmarried Women
Demographics Similar to Uruguayans by Births to Unmarried Women
In terms of births to unmarried women, the demographic groups most similar to Uruguayans are German Russian (33.1%, a difference of 0.060%), Immigrants from Africa (33.0%, a difference of 0.29%), Immigrants from Sudan (33.2%, a difference of 0.29%), Ute (33.0%, a difference of 0.31%), and Hawaiian (33.2%, a difference of 0.32%).
| Demographics | Rating | Rank | Births to Unmarried Women |
| Immigrants | Thailand | 18.9 /100 | #199 | Poor 32.8% |
| Immigrants | Germany | 18.8 /100 | #200 | Poor 32.8% |
| Immigrants | Burma/Myanmar | 16.7 /100 | #201 | Poor 32.9% |
| Immigrants | Micronesia | 16.6 /100 | #202 | Poor 32.9% |
| Ute | 14.4 /100 | #203 | Poor 33.0% |
| Immigrants | Africa | 14.3 /100 | #204 | Poor 33.0% |
| German Russians | 13.1 /100 | #205 | Poor 33.1% |
| Uruguayans | 12.8 /100 | #206 | Poor 33.1% |
| Immigrants | Sudan | 11.5 /100 | #207 | Poor 33.2% |
| Hawaiians | 11.3 /100 | #208 | Poor 33.2% |
| Whites/Caucasians | 10.7 /100 | #209 | Poor 33.3% |
| Scotch-Irish | 10.7 /100 | #210 | Poor 33.3% |
| Ecuadorians | 10.5 /100 | #211 | Poor 33.3% |
| Celtics | 10.2 /100 | #212 | Poor 33.3% |
| Immigrants | Costa Rica | 9.5 /100 | #213 | Tragic 33.4% |
Demographics Similar to Sub-Saharan Africans by Births to Unmarried Women
In terms of births to unmarried women, the demographic groups most similar to Sub-Saharan Africans are Cherokee (36.7%, a difference of 0.050%), Immigrants from Senegal (36.7%, a difference of 0.10%), Nicaraguan (36.6%, a difference of 0.12%), French American Indian (36.6%, a difference of 0.14%), and Central American (36.7%, a difference of 0.17%).
| Demographics | Rating | Rank | Births to Unmarried Women |
| Immigrants | Grenada | 0.2 /100 | #257 | Tragic 36.3% |
| Americans | 0.2 /100 | #258 | Tragic 36.4% |
| Immigrants | El Salvador | 0.2 /100 | #259 | Tragic 36.4% |
| Ottawa | 0.2 /100 | #260 | Tragic 36.5% |
| Trinidadians and Tobagonians | 0.2 /100 | #261 | Tragic 36.5% |
| French American Indians | 0.1 /100 | #262 | Tragic 36.6% |
| Nicaraguans | 0.1 /100 | #263 | Tragic 36.6% |
| Sub-Saharan Africans | 0.1 /100 | #264 | Tragic 36.7% |
| Cherokee | 0.1 /100 | #265 | Tragic 36.7% |
| Immigrants | Senegal | 0.1 /100 | #266 | Tragic 36.7% |
| Central Americans | 0.1 /100 | #267 | Tragic 36.7% |
| Comanche | 0.1 /100 | #268 | Tragic 36.7% |
| Senegalese | 0.1 /100 | #269 | Tragic 36.8% |
| Immigrants | Congo | 0.1 /100 | #270 | Tragic 36.8% |
| Immigrants | Barbados | 0.1 /100 | #271 | Tragic 36.8% |