French Canadian vs Subsaharan African Births to Unmarried Women
COMPARE
French Canadian
Subsaharan African
Births to Unmarried Women
Births to Unmarried Women Comparison
French Canadians
Sub-Saharan Africans
34.4%
BIRTHS TO UNMARRIED WOMEN
2.5/ 100
METRIC RATING
232nd/ 347
METRIC RANK
36.7%
BIRTHS TO UNMARRIED WOMEN
0.1/ 100
METRIC RATING
264th/ 347
METRIC RANK
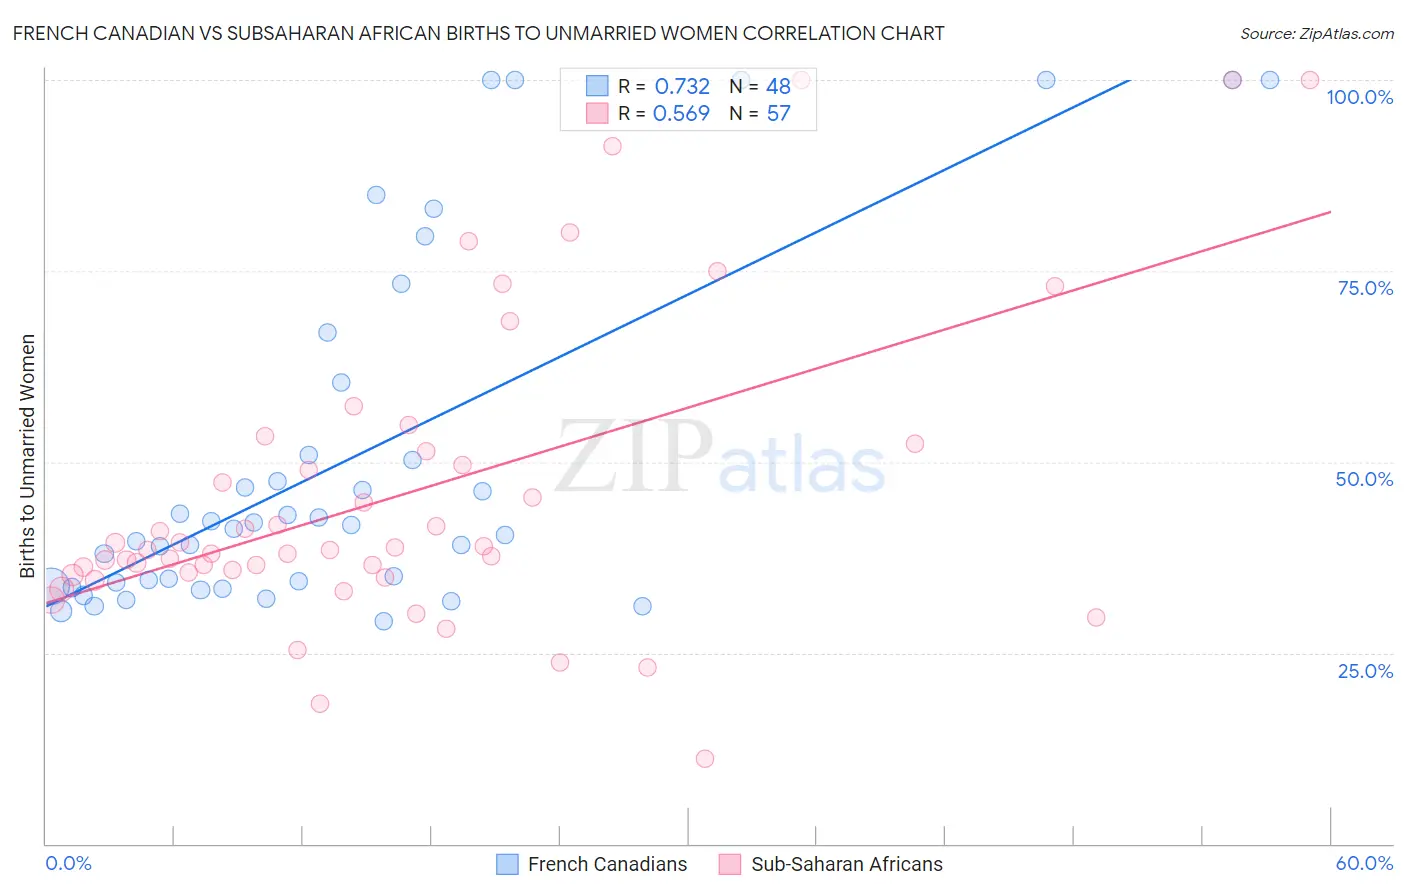
French Canadian vs Subsaharan African Births to Unmarried Women Correlation Chart
The statistical analysis conducted on geographies consisting of 454,698,687 people shows a strong positive correlation between the proportion of French Canadians and percentage of births to unmarried women in the United States with a correlation coefficient (R) of 0.732 and weighted average of 34.4%. Similarly, the statistical analysis conducted on geographies consisting of 468,897,335 people shows a substantial positive correlation between the proportion of Sub-Saharan Africans and percentage of births to unmarried women in the United States with a correlation coefficient (R) of 0.569 and weighted average of 36.7%, a difference of 6.5%.
Births to Unmarried Women Correlation Summary
| Measurement | French Canadian | Subsaharan African |
| Minimum | 29.1% | 11.1% |
| Maximum | 100.0% | 100.0% |
| Range | 70.9% | 88.9% |
| Mean | 50.5% | 45.9% |
| Median | 41.5% | 38.5% |
| Interquartile 25% (IQ1) | 33.9% | 35.3% |
| Interquartile 75% (IQ3) | 55.6% | 51.9% |
| Interquartile Range (IQR) | 21.7% | 16.5% |
| Standard Deviation (Sample) | 23.2% | 20.2% |
| Standard Deviation (Population) | 23.0% | 20.0% |
Similar Demographics by Births to Unmarried Women
Demographics Similar to French Canadians by Births to Unmarried Women
In terms of births to unmarried women, the demographic groups most similar to French Canadians are Bangladeshi (34.4%, a difference of 0.020%), Immigrants from Zaire (34.5%, a difference of 0.26%), Native Hawaiian (34.3%, a difference of 0.30%), Immigrants from Ghana (34.5%, a difference of 0.33%), and Ghanaian (34.3%, a difference of 0.44%).
| Demographics | Rating | Rank | Births to Unmarried Women |
| Spanish | 4.0 /100 | #225 | Tragic 34.1% |
| Delaware | 3.3 /100 | #226 | Tragic 34.2% |
| Immigrants | Panama | 3.3 /100 | #227 | Tragic 34.2% |
| Panamanians | 3.3 /100 | #228 | Tragic 34.2% |
| Immigrants | Sierra Leone | 3.1 /100 | #229 | Tragic 34.2% |
| Ghanaians | 3.1 /100 | #230 | Tragic 34.3% |
| Native Hawaiians | 2.9 /100 | #231 | Tragic 34.3% |
| French Canadians | 2.5 /100 | #232 | Tragic 34.4% |
| Bangladeshis | 2.5 /100 | #233 | Tragic 34.4% |
| Immigrants | Zaire | 2.3 /100 | #234 | Tragic 34.5% |
| Immigrants | Ghana | 2.2 /100 | #235 | Tragic 34.5% |
| Immigrants | Cameroon | 1.6 /100 | #236 | Tragic 34.7% |
| Marshallese | 1.6 /100 | #237 | Tragic 34.8% |
| Immigrants | Cambodia | 1.6 /100 | #238 | Tragic 34.8% |
| Sierra Leoneans | 1.4 /100 | #239 | Tragic 34.9% |
Demographics Similar to Sub-Saharan Africans by Births to Unmarried Women
In terms of births to unmarried women, the demographic groups most similar to Sub-Saharan Africans are Cherokee (36.7%, a difference of 0.050%), Immigrants from Senegal (36.7%, a difference of 0.10%), Nicaraguan (36.6%, a difference of 0.12%), French American Indian (36.6%, a difference of 0.14%), and Central American (36.7%, a difference of 0.17%).
| Demographics | Rating | Rank | Births to Unmarried Women |
| Immigrants | Grenada | 0.2 /100 | #257 | Tragic 36.3% |
| Americans | 0.2 /100 | #258 | Tragic 36.4% |
| Immigrants | El Salvador | 0.2 /100 | #259 | Tragic 36.4% |
| Ottawa | 0.2 /100 | #260 | Tragic 36.5% |
| Trinidadians and Tobagonians | 0.2 /100 | #261 | Tragic 36.5% |
| French American Indians | 0.1 /100 | #262 | Tragic 36.6% |
| Nicaraguans | 0.1 /100 | #263 | Tragic 36.6% |
| Sub-Saharan Africans | 0.1 /100 | #264 | Tragic 36.7% |
| Cherokee | 0.1 /100 | #265 | Tragic 36.7% |
| Immigrants | Senegal | 0.1 /100 | #266 | Tragic 36.7% |
| Central Americans | 0.1 /100 | #267 | Tragic 36.7% |
| Comanche | 0.1 /100 | #268 | Tragic 36.7% |
| Senegalese | 0.1 /100 | #269 | Tragic 36.8% |
| Immigrants | Congo | 0.1 /100 | #270 | Tragic 36.8% |
| Immigrants | Barbados | 0.1 /100 | #271 | Tragic 36.8% |