Uruguayan vs Afghan Births to Unmarried Women
COMPARE
Uruguayan
Afghan
Births to Unmarried Women
Births to Unmarried Women Comparison
Uruguayans
Afghans
33.1%
BIRTHS TO UNMARRIED WOMEN
12.8/ 100
METRIC RATING
206th/ 347
METRIC RANK
27.9%
BIRTHS TO UNMARRIED WOMEN
99.4/ 100
METRIC RATING
54th/ 347
METRIC RANK
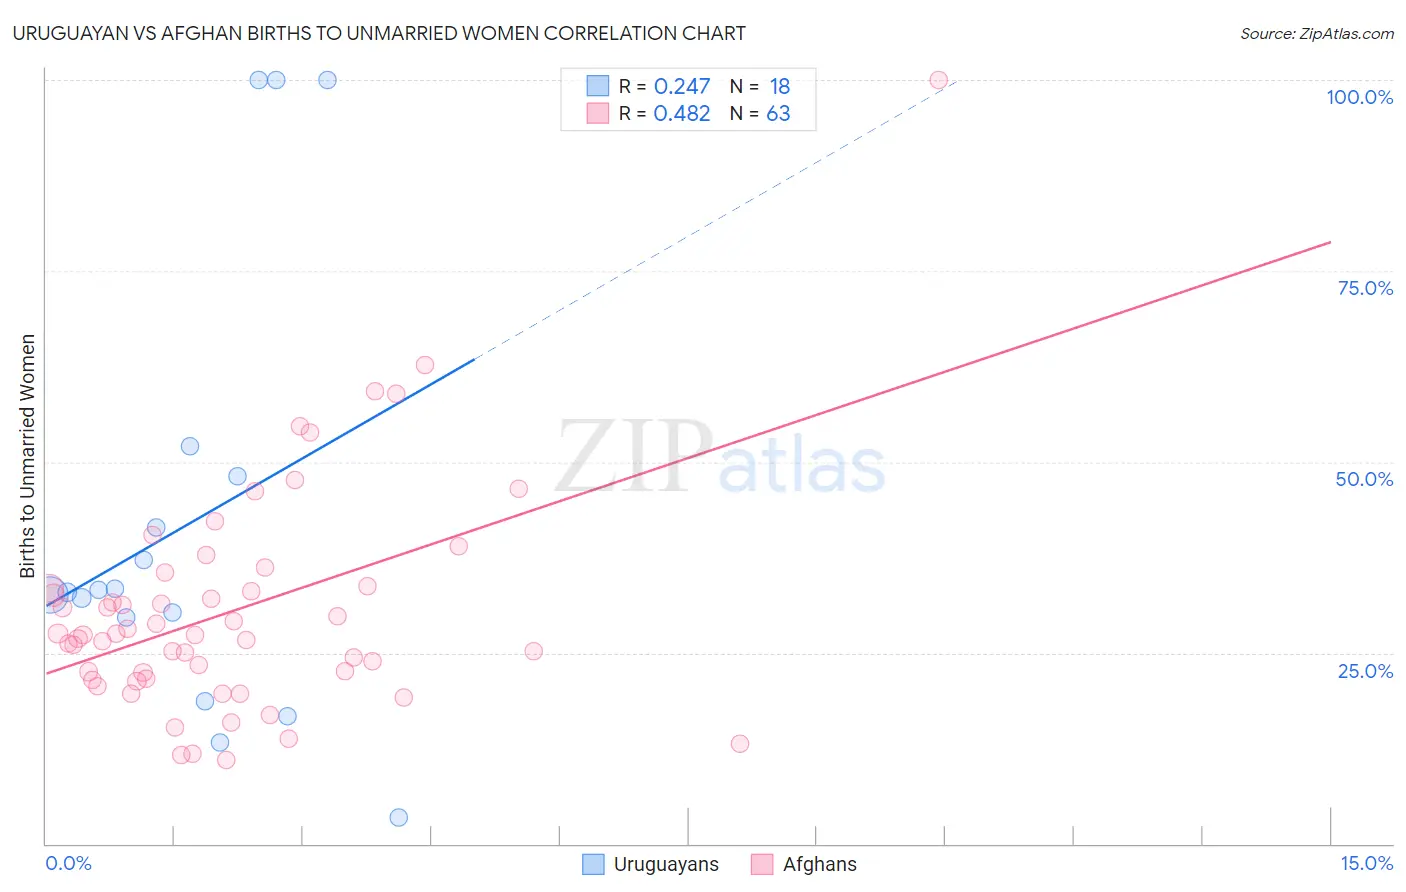
Uruguayan vs Afghan Births to Unmarried Women Correlation Chart
The statistical analysis conducted on geographies consisting of 140,023,012 people shows a weak positive correlation between the proportion of Uruguayans and percentage of births to unmarried women in the United States with a correlation coefficient (R) of 0.247 and weighted average of 33.1%. Similarly, the statistical analysis conducted on geographies consisting of 144,906,952 people shows a moderate positive correlation between the proportion of Afghans and percentage of births to unmarried women in the United States with a correlation coefficient (R) of 0.482 and weighted average of 27.9%, a difference of 18.7%.
Births to Unmarried Women Correlation Summary
| Measurement | Uruguayan | Afghan |
| Minimum | 3.4% | 11.0% |
| Maximum | 100.0% | 100.0% |
| Range | 96.6% | 89.0% |
| Mean | 41.9% | 30.6% |
| Median | 33.1% | 27.4% |
| Interquartile 25% (IQ1) | 29.6% | 21.6% |
| Interquartile 75% (IQ3) | 48.1% | 33.7% |
| Interquartile Range (IQR) | 18.5% | 12.1% |
| Standard Deviation (Sample) | 29.2% | 14.8% |
| Standard Deviation (Population) | 28.3% | 14.7% |
Similar Demographics by Births to Unmarried Women
Demographics Similar to Uruguayans by Births to Unmarried Women
In terms of births to unmarried women, the demographic groups most similar to Uruguayans are German Russian (33.1%, a difference of 0.060%), Immigrants from Africa (33.0%, a difference of 0.29%), Immigrants from Sudan (33.2%, a difference of 0.29%), Ute (33.0%, a difference of 0.31%), and Hawaiian (33.2%, a difference of 0.32%).
| Demographics | Rating | Rank | Births to Unmarried Women |
| Immigrants | Thailand | 18.9 /100 | #199 | Poor 32.8% |
| Immigrants | Germany | 18.8 /100 | #200 | Poor 32.8% |
| Immigrants | Burma/Myanmar | 16.7 /100 | #201 | Poor 32.9% |
| Immigrants | Micronesia | 16.6 /100 | #202 | Poor 32.9% |
| Ute | 14.4 /100 | #203 | Poor 33.0% |
| Immigrants | Africa | 14.3 /100 | #204 | Poor 33.0% |
| German Russians | 13.1 /100 | #205 | Poor 33.1% |
| Uruguayans | 12.8 /100 | #206 | Poor 33.1% |
| Immigrants | Sudan | 11.5 /100 | #207 | Poor 33.2% |
| Hawaiians | 11.3 /100 | #208 | Poor 33.2% |
| Whites/Caucasians | 10.7 /100 | #209 | Poor 33.3% |
| Scotch-Irish | 10.7 /100 | #210 | Poor 33.3% |
| Ecuadorians | 10.5 /100 | #211 | Poor 33.3% |
| Celtics | 10.2 /100 | #212 | Poor 33.3% |
| Immigrants | Costa Rica | 9.5 /100 | #213 | Tragic 33.4% |
Demographics Similar to Afghans by Births to Unmarried Women
In terms of births to unmarried women, the demographic groups most similar to Afghans are Mongolian (27.9%, a difference of 0.040%), Immigrants from Romania (27.9%, a difference of 0.070%), Bhutanese (27.9%, a difference of 0.090%), Macedonian (27.9%, a difference of 0.12%), and Maltese (27.8%, a difference of 0.25%).
| Demographics | Rating | Rank | Births to Unmarried Women |
| Hmong | 99.5 /100 | #47 | Exceptional 27.7% |
| Eastern Europeans | 99.5 /100 | #48 | Exceptional 27.7% |
| Immigrants | Greece | 99.4 /100 | #49 | Exceptional 27.8% |
| Maltese | 99.4 /100 | #50 | Exceptional 27.8% |
| Macedonians | 99.4 /100 | #51 | Exceptional 27.9% |
| Bhutanese | 99.4 /100 | #52 | Exceptional 27.9% |
| Immigrants | Romania | 99.4 /100 | #53 | Exceptional 27.9% |
| Afghans | 99.4 /100 | #54 | Exceptional 27.9% |
| Mongolians | 99.3 /100 | #55 | Exceptional 27.9% |
| Immigrants | Belgium | 99.3 /100 | #56 | Exceptional 28.0% |
| Russians | 99.2 /100 | #57 | Exceptional 28.0% |
| Immigrants | Albania | 99.2 /100 | #58 | Exceptional 28.0% |
| Immigrants | Kazakhstan | 99.1 /100 | #59 | Exceptional 28.1% |
| Immigrants | Turkey | 99.1 /100 | #60 | Exceptional 28.1% |
| Immigrants | North Macedonia | 99.1 /100 | #61 | Exceptional 28.1% |