Immigrants from Honduras vs Subsaharan African Births to Unmarried Women
COMPARE
Immigrants from Honduras
Subsaharan African
Births to Unmarried Women
Births to Unmarried Women Comparison
Immigrants from Honduras
Sub-Saharan Africans
39.3%
BIRTHS TO UNMARRIED WOMEN
0.0/ 100
METRIC RATING
307th/ 347
METRIC RANK
36.7%
BIRTHS TO UNMARRIED WOMEN
0.1/ 100
METRIC RATING
264th/ 347
METRIC RANK
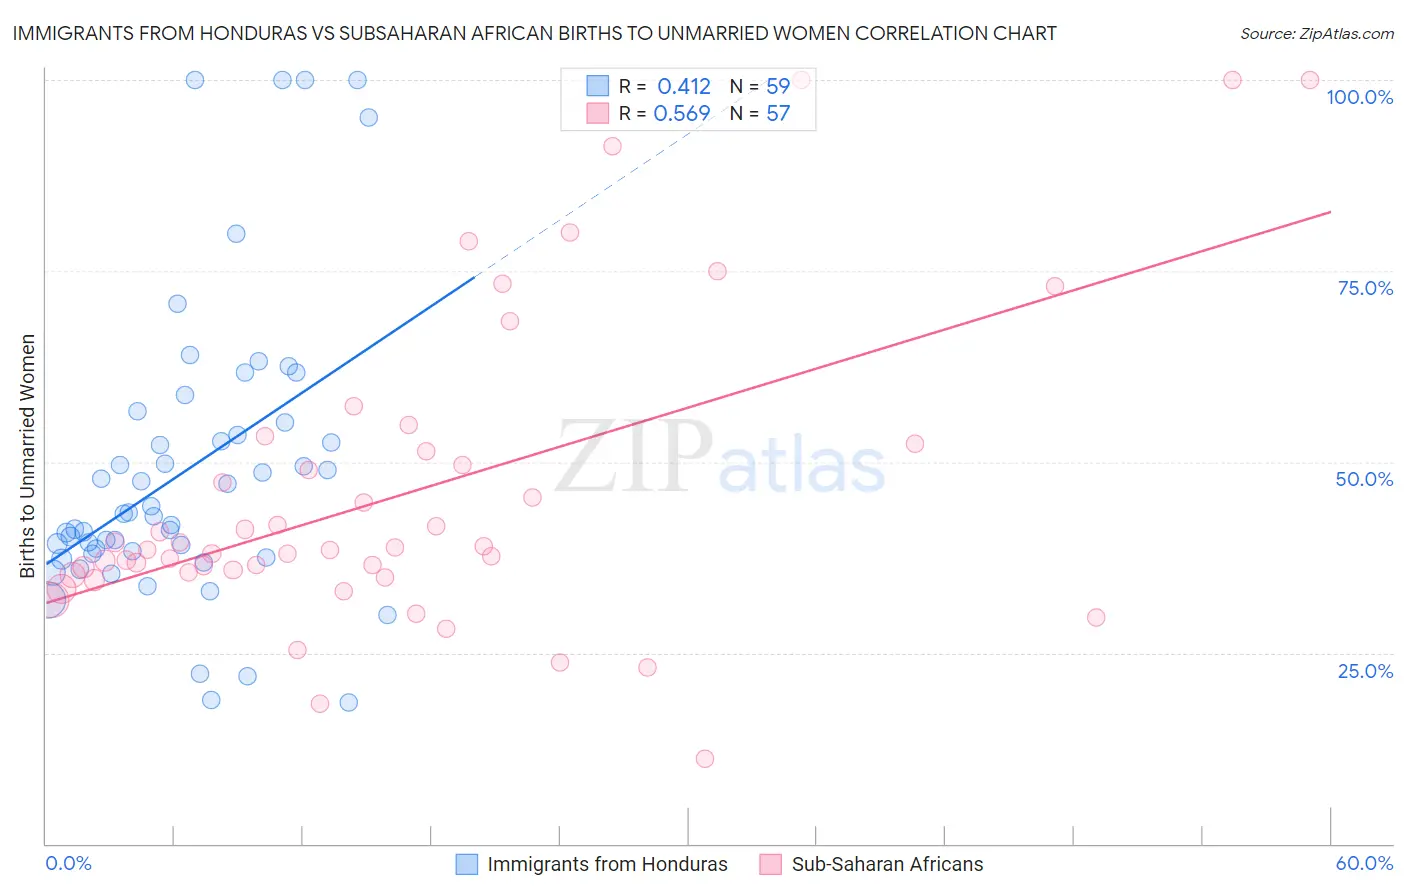
Immigrants from Honduras vs Subsaharan African Births to Unmarried Women Correlation Chart
The statistical analysis conducted on geographies consisting of 311,068,585 people shows a moderate positive correlation between the proportion of Immigrants from Honduras and percentage of births to unmarried women in the United States with a correlation coefficient (R) of 0.412 and weighted average of 39.3%. Similarly, the statistical analysis conducted on geographies consisting of 468,897,335 people shows a substantial positive correlation between the proportion of Sub-Saharan Africans and percentage of births to unmarried women in the United States with a correlation coefficient (R) of 0.569 and weighted average of 36.7%, a difference of 7.2%.
Births to Unmarried Women Correlation Summary
| Measurement | Immigrants from Honduras | Subsaharan African |
| Minimum | 18.5% | 11.1% |
| Maximum | 100.0% | 100.0% |
| Range | 81.5% | 88.9% |
| Mean | 49.0% | 45.9% |
| Median | 43.2% | 38.5% |
| Interquartile 25% (IQ1) | 38.0% | 35.3% |
| Interquartile 75% (IQ3) | 55.1% | 51.9% |
| Interquartile Range (IQR) | 17.1% | 16.5% |
| Standard Deviation (Sample) | 19.4% | 20.2% |
| Standard Deviation (Population) | 19.2% | 20.0% |
Similar Demographics by Births to Unmarried Women
Demographics Similar to Immigrants from Honduras by Births to Unmarried Women
In terms of births to unmarried women, the demographic groups most similar to Immigrants from Honduras are Aleut (39.3%, a difference of 0.090%), Cuban (39.4%, a difference of 0.21%), Immigrants from Dominica (39.5%, a difference of 0.43%), Immigrants from the Azores (39.6%, a difference of 0.67%), and U.S. Virgin Islander (39.6%, a difference of 0.69%).
| Demographics | Rating | Rank | Births to Unmarried Women |
| Immigrants | West Indies | 0.0 /100 | #300 | Tragic 38.6% |
| Haitians | 0.0 /100 | #301 | Tragic 38.6% |
| Hondurans | 0.0 /100 | #302 | Tragic 38.7% |
| Immigrants | Jamaica | 0.0 /100 | #303 | Tragic 38.8% |
| Yaqui | 0.0 /100 | #304 | Tragic 38.8% |
| Immigrants | Haiti | 0.0 /100 | #305 | Tragic 38.9% |
| Central American Indians | 0.0 /100 | #306 | Tragic 39.0% |
| Immigrants | Honduras | 0.0 /100 | #307 | Tragic 39.3% |
| Aleuts | 0.0 /100 | #308 | Tragic 39.3% |
| Cubans | 0.0 /100 | #309 | Tragic 39.4% |
| Immigrants | Dominica | 0.0 /100 | #310 | Tragic 39.5% |
| Immigrants | Azores | 0.0 /100 | #311 | Tragic 39.6% |
| U.S. Virgin Islanders | 0.0 /100 | #312 | Tragic 39.6% |
| Africans | 0.0 /100 | #313 | Tragic 39.7% |
| Immigrants | Caribbean | 0.0 /100 | #314 | Tragic 39.8% |
Demographics Similar to Sub-Saharan Africans by Births to Unmarried Women
In terms of births to unmarried women, the demographic groups most similar to Sub-Saharan Africans are Cherokee (36.7%, a difference of 0.050%), Immigrants from Senegal (36.7%, a difference of 0.10%), Nicaraguan (36.6%, a difference of 0.12%), French American Indian (36.6%, a difference of 0.14%), and Central American (36.7%, a difference of 0.17%).
| Demographics | Rating | Rank | Births to Unmarried Women |
| Immigrants | Grenada | 0.2 /100 | #257 | Tragic 36.3% |
| Americans | 0.2 /100 | #258 | Tragic 36.4% |
| Immigrants | El Salvador | 0.2 /100 | #259 | Tragic 36.4% |
| Ottawa | 0.2 /100 | #260 | Tragic 36.5% |
| Trinidadians and Tobagonians | 0.2 /100 | #261 | Tragic 36.5% |
| French American Indians | 0.1 /100 | #262 | Tragic 36.6% |
| Nicaraguans | 0.1 /100 | #263 | Tragic 36.6% |
| Sub-Saharan Africans | 0.1 /100 | #264 | Tragic 36.7% |
| Cherokee | 0.1 /100 | #265 | Tragic 36.7% |
| Immigrants | Senegal | 0.1 /100 | #266 | Tragic 36.7% |
| Central Americans | 0.1 /100 | #267 | Tragic 36.7% |
| Comanche | 0.1 /100 | #268 | Tragic 36.7% |
| Senegalese | 0.1 /100 | #269 | Tragic 36.8% |
| Immigrants | Congo | 0.1 /100 | #270 | Tragic 36.8% |
| Immigrants | Barbados | 0.1 /100 | #271 | Tragic 36.8% |