Uruguayan vs Immigrants from Iran Currently Married
COMPARE
Uruguayan
Immigrants from Iran
Currently Married
Currently Married Comparison
Uruguayans
Immigrants from Iran
45.6%
CURRENTLY MARRIED
7.9/ 100
METRIC RATING
210th/ 347
METRIC RANK
48.7%
CURRENTLY MARRIED
99.2/ 100
METRIC RATING
46th/ 347
METRIC RANK
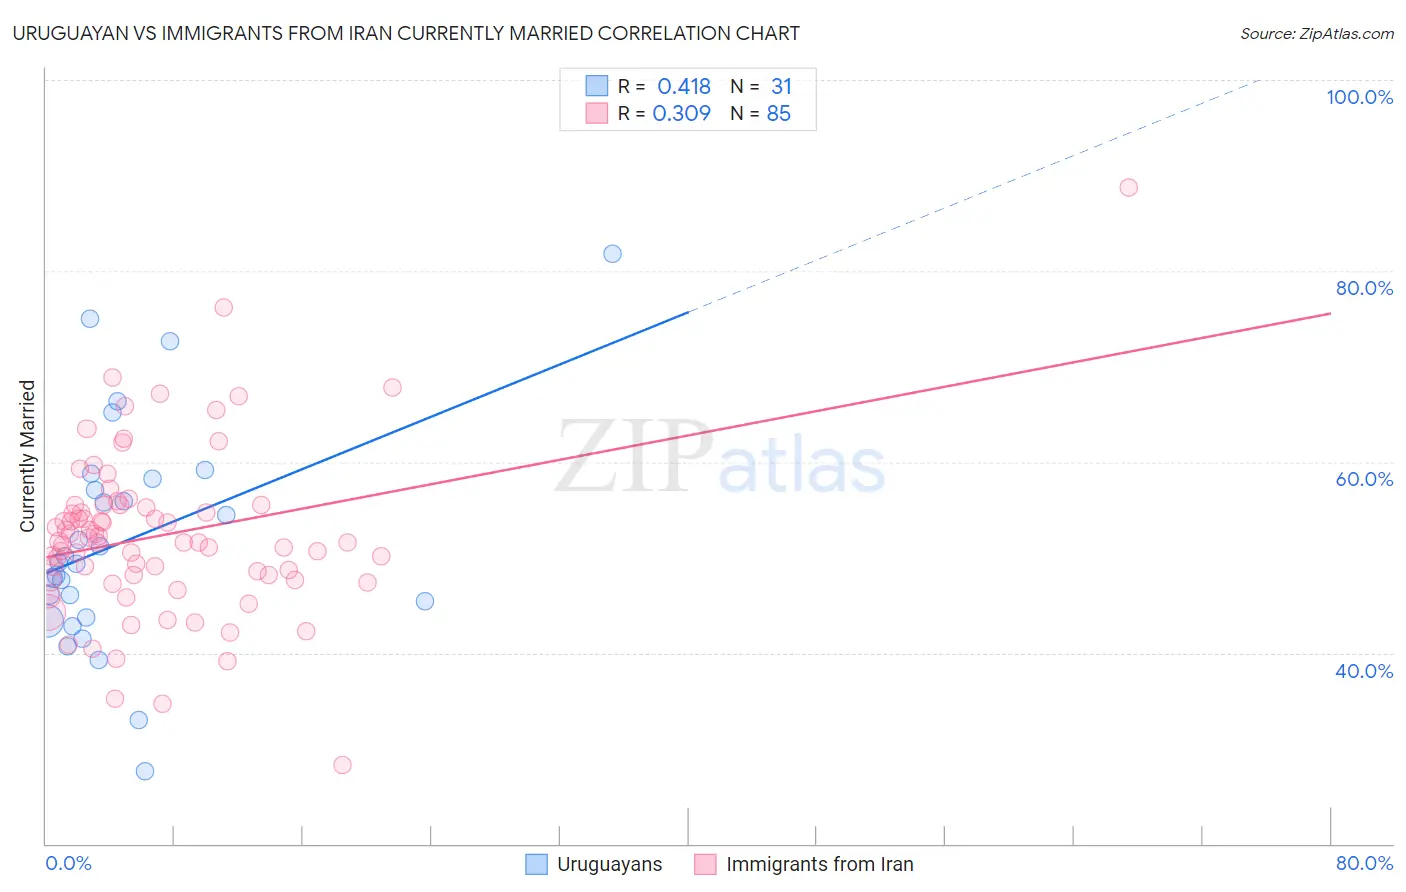
Uruguayan vs Immigrants from Iran Currently Married Correlation Chart
The statistical analysis conducted on geographies consisting of 144,776,099 people shows a moderate positive correlation between the proportion of Uruguayans and percentage of population currently married in the United States with a correlation coefficient (R) of 0.418 and weighted average of 45.6%. Similarly, the statistical analysis conducted on geographies consisting of 279,835,322 people shows a mild positive correlation between the proportion of Immigrants from Iran and percentage of population currently married in the United States with a correlation coefficient (R) of 0.309 and weighted average of 48.7%, a difference of 6.9%.
Currently Married Correlation Summary
| Measurement | Uruguayan | Immigrants from Iran |
| Minimum | 27.6% | 28.3% |
| Maximum | 81.8% | 88.7% |
| Range | 54.2% | 60.4% |
| Mean | 51.8% | 52.3% |
| Median | 49.5% | 51.6% |
| Interquartile 25% (IQ1) | 43.7% | 47.9% |
| Interquartile 75% (IQ3) | 58.2% | 55.5% |
| Interquartile Range (IQR) | 14.6% | 7.6% |
| Standard Deviation (Sample) | 11.8% | 8.9% |
| Standard Deviation (Population) | 11.6% | 8.8% |
Similar Demographics by Currently Married
Demographics Similar to Uruguayans by Currently Married
In terms of currently married, the demographic groups most similar to Uruguayans are Houma (45.5%, a difference of 0.090%), Marshallese (45.5%, a difference of 0.090%), Immigrants from Micronesia (45.6%, a difference of 0.11%), Alaska Native (45.5%, a difference of 0.12%), and Dutch West Indian (45.5%, a difference of 0.16%).
| Demographics | Rating | Rank | Currently Married |
| Taiwanese | 11.7 /100 | #203 | Poor 45.8% |
| Immigrants | Spain | 11.6 /100 | #204 | Poor 45.8% |
| South American Indians | 11.5 /100 | #205 | Poor 45.8% |
| Immigrants | Immigrants | 11.2 /100 | #206 | Poor 45.8% |
| Immigrants | South America | 10.8 /100 | #207 | Poor 45.7% |
| Alsatians | 10.8 /100 | #208 | Poor 45.7% |
| Immigrants | Micronesia | 8.8 /100 | #209 | Tragic 45.6% |
| Uruguayans | 7.9 /100 | #210 | Tragic 45.6% |
| Houma | 7.2 /100 | #211 | Tragic 45.5% |
| Marshallese | 7.2 /100 | #212 | Tragic 45.5% |
| Alaska Natives | 7.0 /100 | #213 | Tragic 45.5% |
| Dutch West Indians | 6.7 /100 | #214 | Tragic 45.5% |
| German Russians | 6.7 /100 | #215 | Tragic 45.5% |
| Immigrants | Morocco | 5.5 /100 | #216 | Tragic 45.4% |
| Immigrants | Thailand | 5.1 /100 | #217 | Tragic 45.4% |
Demographics Similar to Immigrants from Iran by Currently Married
In terms of currently married, the demographic groups most similar to Immigrants from Iran are Northern European (48.7%, a difference of 0.010%), Austrian (48.7%, a difference of 0.020%), Belgian (48.7%, a difference of 0.030%), Immigrants from North America (48.7%, a difference of 0.060%), and Finnish (48.8%, a difference of 0.090%).
| Demographics | Rating | Rank | Currently Married |
| British | 99.4 /100 | #39 | Exceptional 48.8% |
| Immigrants | Canada | 99.4 /100 | #40 | Exceptional 48.8% |
| Greeks | 99.3 /100 | #41 | Exceptional 48.8% |
| Finns | 99.3 /100 | #42 | Exceptional 48.8% |
| Scotch-Irish | 99.3 /100 | #43 | Exceptional 48.7% |
| Immigrants | North America | 99.3 /100 | #44 | Exceptional 48.7% |
| Belgians | 99.3 /100 | #45 | Exceptional 48.7% |
| Immigrants | Iran | 99.2 /100 | #46 | Exceptional 48.7% |
| Northern Europeans | 99.2 /100 | #47 | Exceptional 48.7% |
| Austrians | 99.2 /100 | #48 | Exceptional 48.7% |
| Bhutanese | 99.1 /100 | #49 | Exceptional 48.6% |
| Iranians | 99.0 /100 | #50 | Exceptional 48.6% |
| Whites/Caucasians | 99.0 /100 | #51 | Exceptional 48.6% |
| Russians | 98.9 /100 | #52 | Exceptional 48.6% |
| Immigrants | Austria | 98.8 /100 | #53 | Exceptional 48.5% |