Uruguayan vs Immigrants from Eastern Europe Currently Married
COMPARE
Uruguayan
Immigrants from Eastern Europe
Currently Married
Currently Married Comparison
Uruguayans
Immigrants from Eastern Europe
45.6%
CURRENTLY MARRIED
7.9/ 100
METRIC RATING
210th/ 347
METRIC RANK
48.0%
CURRENTLY MARRIED
96.1/ 100
METRIC RATING
88th/ 347
METRIC RANK
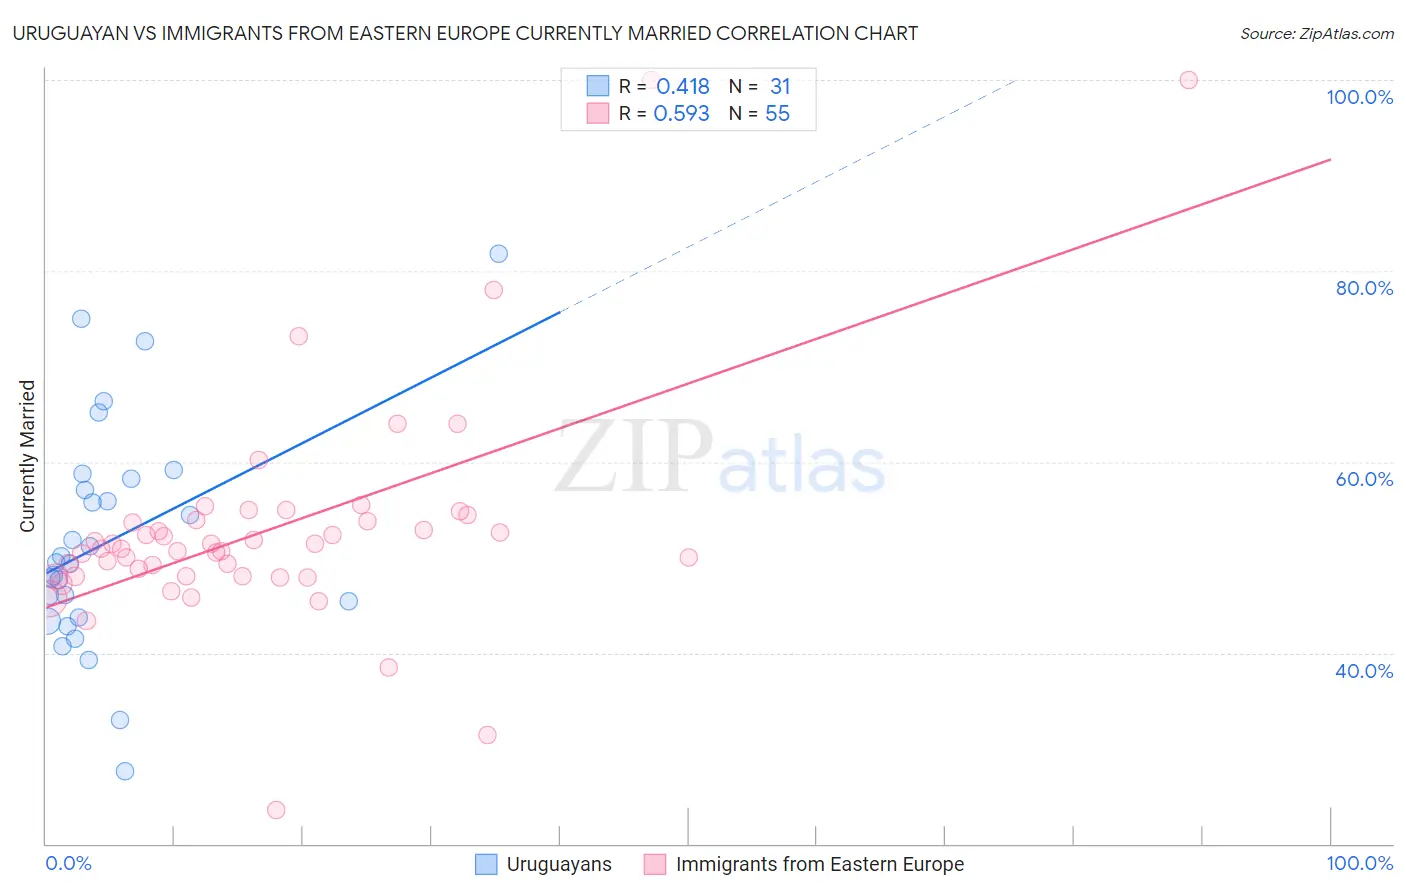
Uruguayan vs Immigrants from Eastern Europe Currently Married Correlation Chart
The statistical analysis conducted on geographies consisting of 144,776,099 people shows a moderate positive correlation between the proportion of Uruguayans and percentage of population currently married in the United States with a correlation coefficient (R) of 0.418 and weighted average of 45.6%. Similarly, the statistical analysis conducted on geographies consisting of 475,818,716 people shows a substantial positive correlation between the proportion of Immigrants from Eastern Europe and percentage of population currently married in the United States with a correlation coefficient (R) of 0.593 and weighted average of 48.0%, a difference of 5.3%.
Currently Married Correlation Summary
| Measurement | Uruguayan | Immigrants from Eastern Europe |
| Minimum | 27.6% | 23.5% |
| Maximum | 81.8% | 100.0% |
| Range | 54.2% | 76.5% |
| Mean | 51.8% | 52.9% |
| Median | 49.5% | 50.9% |
| Interquartile 25% (IQ1) | 43.7% | 48.1% |
| Interquartile 75% (IQ3) | 58.2% | 53.9% |
| Interquartile Range (IQR) | 14.6% | 5.9% |
| Standard Deviation (Sample) | 11.8% | 12.1% |
| Standard Deviation (Population) | 11.6% | 12.0% |
Similar Demographics by Currently Married
Demographics Similar to Uruguayans by Currently Married
In terms of currently married, the demographic groups most similar to Uruguayans are Houma (45.5%, a difference of 0.090%), Marshallese (45.5%, a difference of 0.090%), Immigrants from Micronesia (45.6%, a difference of 0.11%), Alaska Native (45.5%, a difference of 0.12%), and Dutch West Indian (45.5%, a difference of 0.16%).
| Demographics | Rating | Rank | Currently Married |
| Taiwanese | 11.7 /100 | #203 | Poor 45.8% |
| Immigrants | Spain | 11.6 /100 | #204 | Poor 45.8% |
| South American Indians | 11.5 /100 | #205 | Poor 45.8% |
| Immigrants | Immigrants | 11.2 /100 | #206 | Poor 45.8% |
| Immigrants | South America | 10.8 /100 | #207 | Poor 45.7% |
| Alsatians | 10.8 /100 | #208 | Poor 45.7% |
| Immigrants | Micronesia | 8.8 /100 | #209 | Tragic 45.6% |
| Uruguayans | 7.9 /100 | #210 | Tragic 45.6% |
| Houma | 7.2 /100 | #211 | Tragic 45.5% |
| Marshallese | 7.2 /100 | #212 | Tragic 45.5% |
| Alaska Natives | 7.0 /100 | #213 | Tragic 45.5% |
| Dutch West Indians | 6.7 /100 | #214 | Tragic 45.5% |
| German Russians | 6.7 /100 | #215 | Tragic 45.5% |
| Immigrants | Morocco | 5.5 /100 | #216 | Tragic 45.4% |
| Immigrants | Thailand | 5.1 /100 | #217 | Tragic 45.4% |
Demographics Similar to Immigrants from Eastern Europe by Currently Married
In terms of currently married, the demographic groups most similar to Immigrants from Eastern Europe are Jordanian (48.0%, a difference of 0.020%), Immigrants from Japan (48.0%, a difference of 0.030%), French Canadian (48.0%, a difference of 0.060%), Indian (Asian) (48.0%, a difference of 0.060%), and American (48.0%, a difference of 0.080%).
| Demographics | Rating | Rank | Currently Married |
| Immigrants | Sri Lanka | 96.9 /100 | #81 | Exceptional 48.1% |
| Immigrants | Europe | 96.9 /100 | #82 | Exceptional 48.1% |
| Bolivians | 96.9 /100 | #83 | Exceptional 48.1% |
| Immigrants | Israel | 96.9 /100 | #84 | Exceptional 48.1% |
| French Canadians | 96.3 /100 | #85 | Exceptional 48.0% |
| Immigrants | Japan | 96.2 /100 | #86 | Exceptional 48.0% |
| Jordanians | 96.2 /100 | #87 | Exceptional 48.0% |
| Immigrants | Eastern Europe | 96.1 /100 | #88 | Exceptional 48.0% |
| Indians (Asian) | 95.8 /100 | #89 | Exceptional 48.0% |
| Americans | 95.7 /100 | #90 | Exceptional 48.0% |
| Immigrants | Bolivia | 95.6 /100 | #91 | Exceptional 47.9% |
| Koreans | 95.4 /100 | #92 | Exceptional 47.9% |
| Lebanese | 95.1 /100 | #93 | Exceptional 47.9% |
| Native Hawaiians | 95.0 /100 | #94 | Exceptional 47.9% |
| Immigrants | Bulgaria | 94.8 /100 | #95 | Exceptional 47.9% |