Uruguayan vs Immigrants from Iran 2nd Grade
COMPARE
Uruguayan
Immigrants from Iran
2nd Grade
2nd Grade Comparison
Uruguayans
Immigrants from Iran
97.7%
2ND GRADE
6.2/ 100
METRIC RATING
217th/ 347
METRIC RANK
97.9%
2ND GRADE
62.8/ 100
METRIC RATING
158th/ 347
METRIC RANK
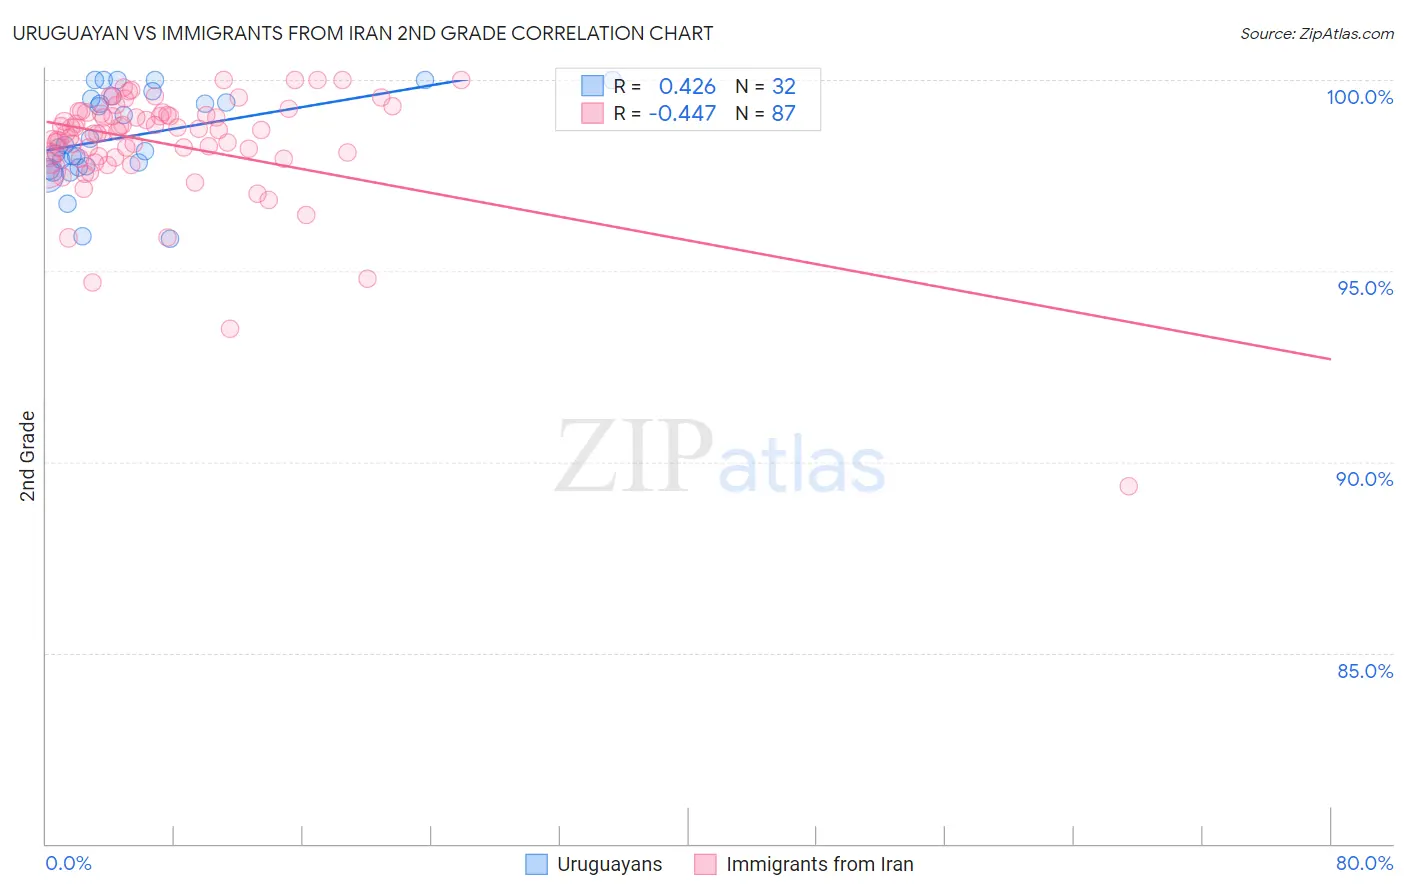
Uruguayan vs Immigrants from Iran 2nd Grade Correlation Chart
The statistical analysis conducted on geographies consisting of 144,782,794 people shows a moderate positive correlation between the proportion of Uruguayans and percentage of population with at least 2nd grade education in the United States with a correlation coefficient (R) of 0.426 and weighted average of 97.7%. Similarly, the statistical analysis conducted on geographies consisting of 279,905,207 people shows a moderate negative correlation between the proportion of Immigrants from Iran and percentage of population with at least 2nd grade education in the United States with a correlation coefficient (R) of -0.447 and weighted average of 97.9%, a difference of 0.26%.
2nd Grade Correlation Summary
| Measurement | Uruguayan | Immigrants from Iran |
| Minimum | 95.8% | 89.4% |
| Maximum | 100.0% | 100.0% |
| Range | 4.2% | 10.6% |
| Mean | 98.5% | 98.3% |
| Median | 98.3% | 98.7% |
| Interquartile 25% (IQ1) | 97.7% | 98.0% |
| Interquartile 75% (IQ3) | 99.5% | 99.1% |
| Interquartile Range (IQR) | 1.8% | 1.1% |
| Standard Deviation (Sample) | 1.2% | 1.5% |
| Standard Deviation (Population) | 1.2% | 1.5% |
Similar Demographics by 2nd Grade
Demographics Similar to Uruguayans by 2nd Grade
In terms of 2nd grade, the demographic groups most similar to Uruguayans are Samoan (97.7%, a difference of 0.010%), Bahamian (97.7%, a difference of 0.010%), South American Indian (97.7%, a difference of 0.010%), Sudanese (97.7%, a difference of 0.010%), and Moroccan (97.7%, a difference of 0.020%).
| Demographics | Rating | Rank | 2nd Grade |
| Costa Ricans | 10.5 /100 | #210 | Poor 97.7% |
| Laotians | 9.9 /100 | #211 | Tragic 97.7% |
| Immigrants | Bahamas | 8.4 /100 | #212 | Tragic 97.7% |
| Moroccans | 8.2 /100 | #213 | Tragic 97.7% |
| Samoans | 7.1 /100 | #214 | Tragic 97.7% |
| Bahamians | 6.8 /100 | #215 | Tragic 97.7% |
| South American Indians | 6.7 /100 | #216 | Tragic 97.7% |
| Uruguayans | 6.2 /100 | #217 | Tragic 97.7% |
| Sudanese | 5.7 /100 | #218 | Tragic 97.7% |
| Immigrants | Panama | 5.1 /100 | #219 | Tragic 97.6% |
| Immigrants | Morocco | 5.0 /100 | #220 | Tragic 97.6% |
| Iraqis | 4.6 /100 | #221 | Tragic 97.6% |
| Immigrants | Sudan | 4.5 /100 | #222 | Tragic 97.6% |
| Sierra Leoneans | 4.3 /100 | #223 | Tragic 97.6% |
| Immigrants | Zaire | 4.3 /100 | #224 | Tragic 97.6% |
Demographics Similar to Immigrants from Iran by 2nd Grade
In terms of 2nd grade, the demographic groups most similar to Immigrants from Iran are Dutch West Indian (97.9%, a difference of 0.0%), Venezuelan (97.9%, a difference of 0.0%), Comanche (97.9%, a difference of 0.0%), French American Indian (97.9%, a difference of 0.010%), and Immigrants from Eastern Europe (97.9%, a difference of 0.010%).
| Demographics | Rating | Rank | 2nd Grade |
| Soviet Union | 70.7 /100 | #151 | Good 97.9% |
| Immigrants | North Macedonia | 68.5 /100 | #152 | Good 97.9% |
| Immigrants | South Central Asia | 68.3 /100 | #153 | Good 97.9% |
| Marshallese | 67.7 /100 | #154 | Good 97.9% |
| French American Indians | 64.3 /100 | #155 | Good 97.9% |
| Dutch West Indians | 63.8 /100 | #156 | Good 97.9% |
| Venezuelans | 63.3 /100 | #157 | Good 97.9% |
| Immigrants | Iran | 62.8 /100 | #158 | Good 97.9% |
| Comanche | 62.8 /100 | #159 | Good 97.9% |
| Immigrants | Eastern Europe | 61.1 /100 | #160 | Good 97.9% |
| Immigrants | Russia | 60.3 /100 | #161 | Good 97.9% |
| Immigrants | Italy | 60.2 /100 | #162 | Good 97.9% |
| Bermudans | 59.4 /100 | #163 | Average 97.9% |
| Ugandans | 56.6 /100 | #164 | Average 97.9% |
| Spanish Americans | 56.4 /100 | #165 | Average 97.9% |