Bangladeshi vs Immigrants from Iran Currently Married
COMPARE
Bangladeshi
Immigrants from Iran
Currently Married
Currently Married Comparison
Bangladeshis
Immigrants from Iran
43.7%
CURRENTLY MARRIED
0.1/ 100
METRIC RATING
262nd/ 347
METRIC RANK
48.7%
CURRENTLY MARRIED
99.2/ 100
METRIC RATING
46th/ 347
METRIC RANK
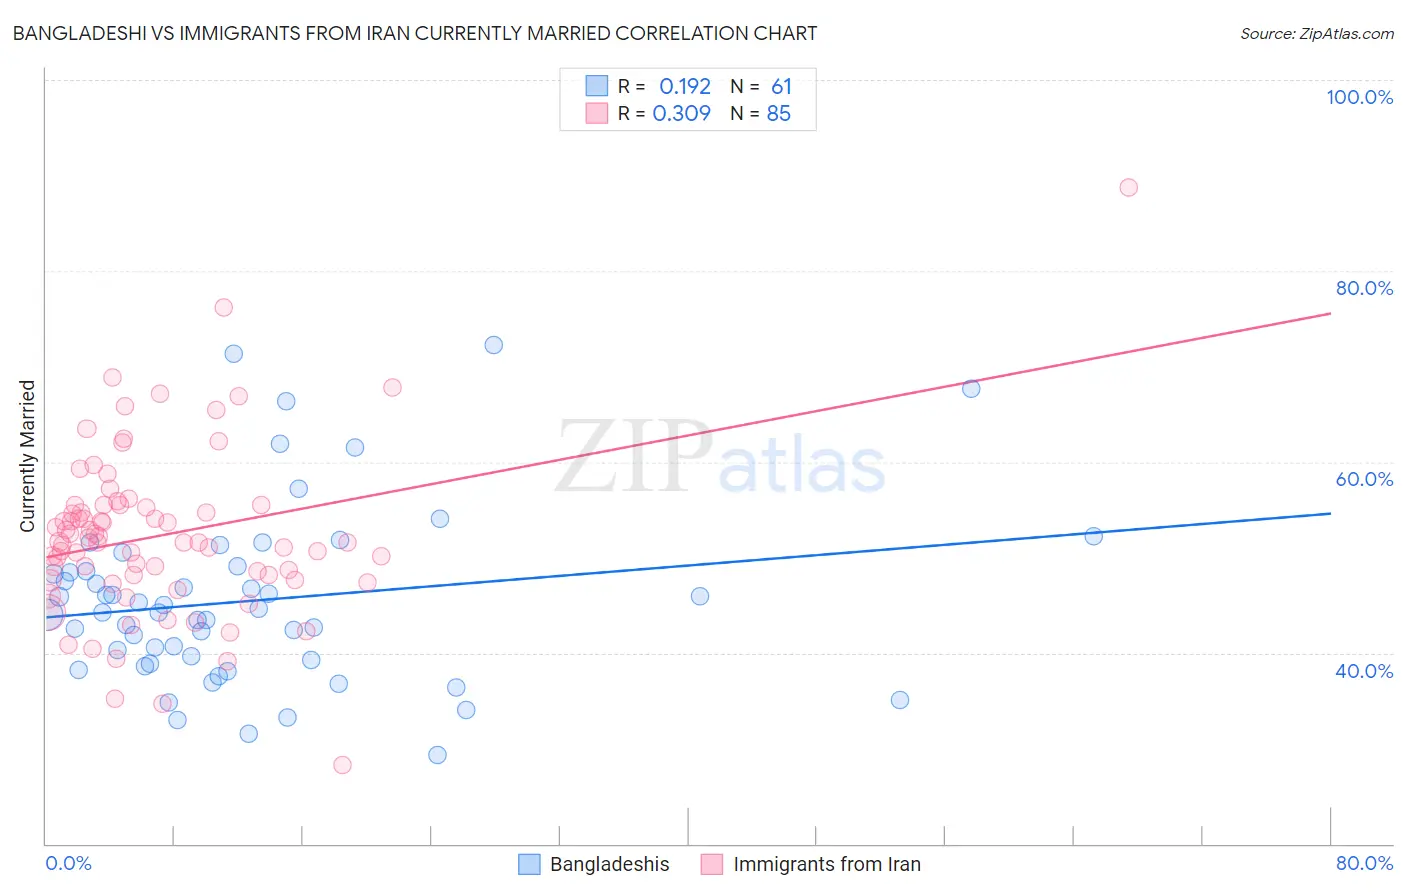
Bangladeshi vs Immigrants from Iran Currently Married Correlation Chart
The statistical analysis conducted on geographies consisting of 141,443,352 people shows a poor positive correlation between the proportion of Bangladeshis and percentage of population currently married in the United States with a correlation coefficient (R) of 0.192 and weighted average of 43.7%. Similarly, the statistical analysis conducted on geographies consisting of 279,835,322 people shows a mild positive correlation between the proportion of Immigrants from Iran and percentage of population currently married in the United States with a correlation coefficient (R) of 0.309 and weighted average of 48.7%, a difference of 11.5%.
Currently Married Correlation Summary
| Measurement | Bangladeshi | Immigrants from Iran |
| Minimum | 29.3% | 28.3% |
| Maximum | 72.2% | 88.7% |
| Range | 42.9% | 60.4% |
| Mean | 45.5% | 52.3% |
| Median | 44.3% | 51.6% |
| Interquartile 25% (IQ1) | 39.0% | 47.9% |
| Interquartile 75% (IQ3) | 48.8% | 55.5% |
| Interquartile Range (IQR) | 9.8% | 7.6% |
| Standard Deviation (Sample) | 9.3% | 8.9% |
| Standard Deviation (Population) | 9.2% | 8.8% |
Similar Demographics by Currently Married
Demographics Similar to Bangladeshis by Currently Married
In terms of currently married, the demographic groups most similar to Bangladeshis are Immigrants from Cuba (43.7%, a difference of 0.040%), Sudanese (43.7%, a difference of 0.050%), Immigrants from Nicaragua (43.7%, a difference of 0.14%), Immigrants from Bangladesh (43.6%, a difference of 0.14%), and Immigrants from Latin America (43.8%, a difference of 0.18%).
| Demographics | Rating | Rank | Currently Married |
| Yakama | 0.2 /100 | #255 | Tragic 44.0% |
| Shoshone | 0.2 /100 | #256 | Tragic 44.0% |
| Immigrants | Africa | 0.2 /100 | #257 | Tragic 43.9% |
| Ute | 0.2 /100 | #258 | Tragic 43.9% |
| Immigrants | Sierra Leone | 0.1 /100 | #259 | Tragic 43.8% |
| Immigrants | Latin America | 0.1 /100 | #260 | Tragic 43.8% |
| Immigrants | Nicaragua | 0.1 /100 | #261 | Tragic 43.7% |
| Bangladeshis | 0.1 /100 | #262 | Tragic 43.7% |
| Immigrants | Cuba | 0.1 /100 | #263 | Tragic 43.7% |
| Sudanese | 0.1 /100 | #264 | Tragic 43.7% |
| Immigrants | Bangladesh | 0.1 /100 | #265 | Tragic 43.6% |
| Ecuadorians | 0.1 /100 | #266 | Tragic 43.6% |
| Immigrants | Eritrea | 0.1 /100 | #267 | Tragic 43.6% |
| Spanish American Indians | 0.1 /100 | #268 | Tragic 43.6% |
| Immigrants | Sudan | 0.1 /100 | #269 | Tragic 43.5% |
Demographics Similar to Immigrants from Iran by Currently Married
In terms of currently married, the demographic groups most similar to Immigrants from Iran are Northern European (48.7%, a difference of 0.010%), Austrian (48.7%, a difference of 0.020%), Belgian (48.7%, a difference of 0.030%), Immigrants from North America (48.7%, a difference of 0.060%), and Finnish (48.8%, a difference of 0.090%).
| Demographics | Rating | Rank | Currently Married |
| British | 99.4 /100 | #39 | Exceptional 48.8% |
| Immigrants | Canada | 99.4 /100 | #40 | Exceptional 48.8% |
| Greeks | 99.3 /100 | #41 | Exceptional 48.8% |
| Finns | 99.3 /100 | #42 | Exceptional 48.8% |
| Scotch-Irish | 99.3 /100 | #43 | Exceptional 48.7% |
| Immigrants | North America | 99.3 /100 | #44 | Exceptional 48.7% |
| Belgians | 99.3 /100 | #45 | Exceptional 48.7% |
| Immigrants | Iran | 99.2 /100 | #46 | Exceptional 48.7% |
| Northern Europeans | 99.2 /100 | #47 | Exceptional 48.7% |
| Austrians | 99.2 /100 | #48 | Exceptional 48.7% |
| Bhutanese | 99.1 /100 | #49 | Exceptional 48.6% |
| Iranians | 99.0 /100 | #50 | Exceptional 48.6% |
| Whites/Caucasians | 99.0 /100 | #51 | Exceptional 48.6% |
| Russians | 98.9 /100 | #52 | Exceptional 48.6% |
| Immigrants | Austria | 98.8 /100 | #53 | Exceptional 48.5% |