Ghanaian vs Immigrants from Iran Currently Married
COMPARE
Ghanaian
Immigrants from Iran
Currently Married
Currently Married Comparison
Ghanaians
Immigrants from Iran
42.9%
CURRENTLY MARRIED
0.0/ 100
METRIC RATING
286th/ 347
METRIC RANK
48.7%
CURRENTLY MARRIED
99.2/ 100
METRIC RATING
46th/ 347
METRIC RANK
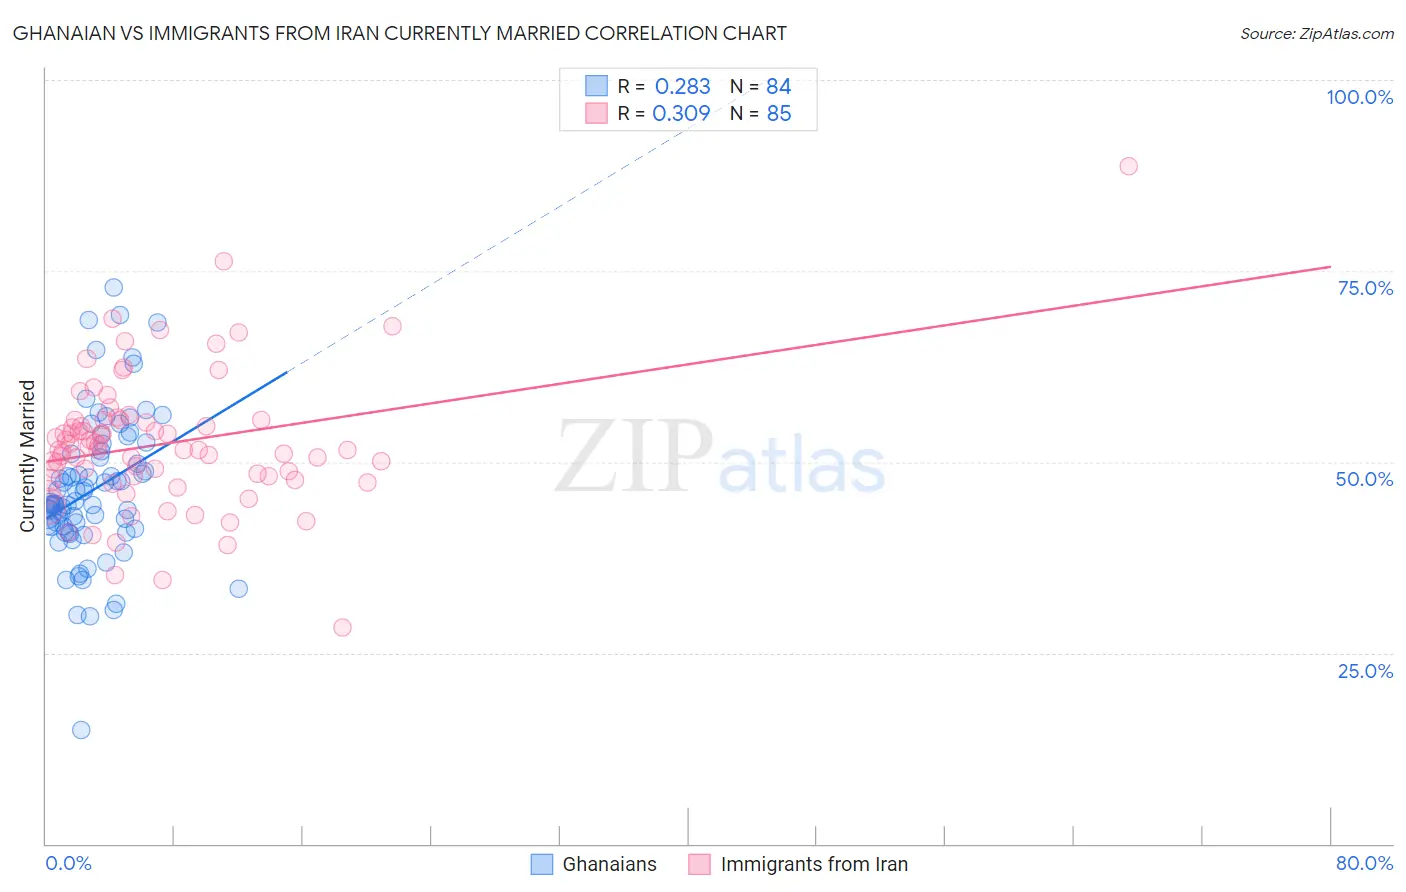
Ghanaian vs Immigrants from Iran Currently Married Correlation Chart
The statistical analysis conducted on geographies consisting of 190,682,082 people shows a weak positive correlation between the proportion of Ghanaians and percentage of population currently married in the United States with a correlation coefficient (R) of 0.283 and weighted average of 42.9%. Similarly, the statistical analysis conducted on geographies consisting of 279,835,322 people shows a mild positive correlation between the proportion of Immigrants from Iran and percentage of population currently married in the United States with a correlation coefficient (R) of 0.309 and weighted average of 48.7%, a difference of 13.5%.
Currently Married Correlation Summary
| Measurement | Ghanaian | Immigrants from Iran |
| Minimum | 14.9% | 28.3% |
| Maximum | 72.9% | 88.7% |
| Range | 58.0% | 60.4% |
| Mean | 46.3% | 52.3% |
| Median | 44.6% | 51.6% |
| Interquartile 25% (IQ1) | 41.5% | 47.9% |
| Interquartile 75% (IQ3) | 51.2% | 55.5% |
| Interquartile Range (IQR) | 9.8% | 7.6% |
| Standard Deviation (Sample) | 9.6% | 8.9% |
| Standard Deviation (Population) | 9.6% | 8.8% |
Similar Demographics by Currently Married
Demographics Similar to Ghanaians by Currently Married
In terms of currently married, the demographic groups most similar to Ghanaians are Guatemalan (42.9%, a difference of 0.020%), Immigrants from Middle Africa (43.0%, a difference of 0.13%), Native/Alaskan (42.8%, a difference of 0.29%), Paiute (42.7%, a difference of 0.52%), and Immigrants from El Salvador (43.1%, a difference of 0.53%).
| Demographics | Rating | Rank | Currently Married |
| Central American Indians | 0.0 /100 | #279 | Tragic 43.3% |
| Apache | 0.0 /100 | #280 | Tragic 43.2% |
| Chippewa | 0.0 /100 | #281 | Tragic 43.2% |
| Immigrants | Ecuador | 0.0 /100 | #282 | Tragic 43.2% |
| Kiowa | 0.0 /100 | #283 | Tragic 43.2% |
| Immigrants | El Salvador | 0.0 /100 | #284 | Tragic 43.1% |
| Immigrants | Middle Africa | 0.0 /100 | #285 | Tragic 43.0% |
| Ghanaians | 0.0 /100 | #286 | Tragic 42.9% |
| Guatemalans | 0.0 /100 | #287 | Tragic 42.9% |
| Natives/Alaskans | 0.0 /100 | #288 | Tragic 42.8% |
| Paiute | 0.0 /100 | #289 | Tragic 42.7% |
| Immigrants | Ghana | 0.0 /100 | #290 | Tragic 42.7% |
| Immigrants | Guatemala | 0.0 /100 | #291 | Tragic 42.6% |
| Sub-Saharan Africans | 0.0 /100 | #292 | Tragic 42.6% |
| Yuman | 0.0 /100 | #293 | Tragic 42.6% |
Demographics Similar to Immigrants from Iran by Currently Married
In terms of currently married, the demographic groups most similar to Immigrants from Iran are Northern European (48.7%, a difference of 0.010%), Austrian (48.7%, a difference of 0.020%), Belgian (48.7%, a difference of 0.030%), Immigrants from North America (48.7%, a difference of 0.060%), and Finnish (48.8%, a difference of 0.090%).
| Demographics | Rating | Rank | Currently Married |
| British | 99.4 /100 | #39 | Exceptional 48.8% |
| Immigrants | Canada | 99.4 /100 | #40 | Exceptional 48.8% |
| Greeks | 99.3 /100 | #41 | Exceptional 48.8% |
| Finns | 99.3 /100 | #42 | Exceptional 48.8% |
| Scotch-Irish | 99.3 /100 | #43 | Exceptional 48.7% |
| Immigrants | North America | 99.3 /100 | #44 | Exceptional 48.7% |
| Belgians | 99.3 /100 | #45 | Exceptional 48.7% |
| Immigrants | Iran | 99.2 /100 | #46 | Exceptional 48.7% |
| Northern Europeans | 99.2 /100 | #47 | Exceptional 48.7% |
| Austrians | 99.2 /100 | #48 | Exceptional 48.7% |
| Bhutanese | 99.1 /100 | #49 | Exceptional 48.6% |
| Iranians | 99.0 /100 | #50 | Exceptional 48.6% |
| Whites/Caucasians | 99.0 /100 | #51 | Exceptional 48.6% |
| Russians | 98.9 /100 | #52 | Exceptional 48.6% |
| Immigrants | Austria | 98.8 /100 | #53 | Exceptional 48.5% |