Immigrants from Northern Africa vs Immigrants from Iran Currently Married
COMPARE
Immigrants from Northern Africa
Immigrants from Iran
Currently Married
Currently Married Comparison
Immigrants from Northern Africa
Immigrants from Iran
46.5%
CURRENTLY MARRIED
39.7/ 100
METRIC RATING
183rd/ 347
METRIC RANK
48.7%
CURRENTLY MARRIED
99.2/ 100
METRIC RATING
46th/ 347
METRIC RANK
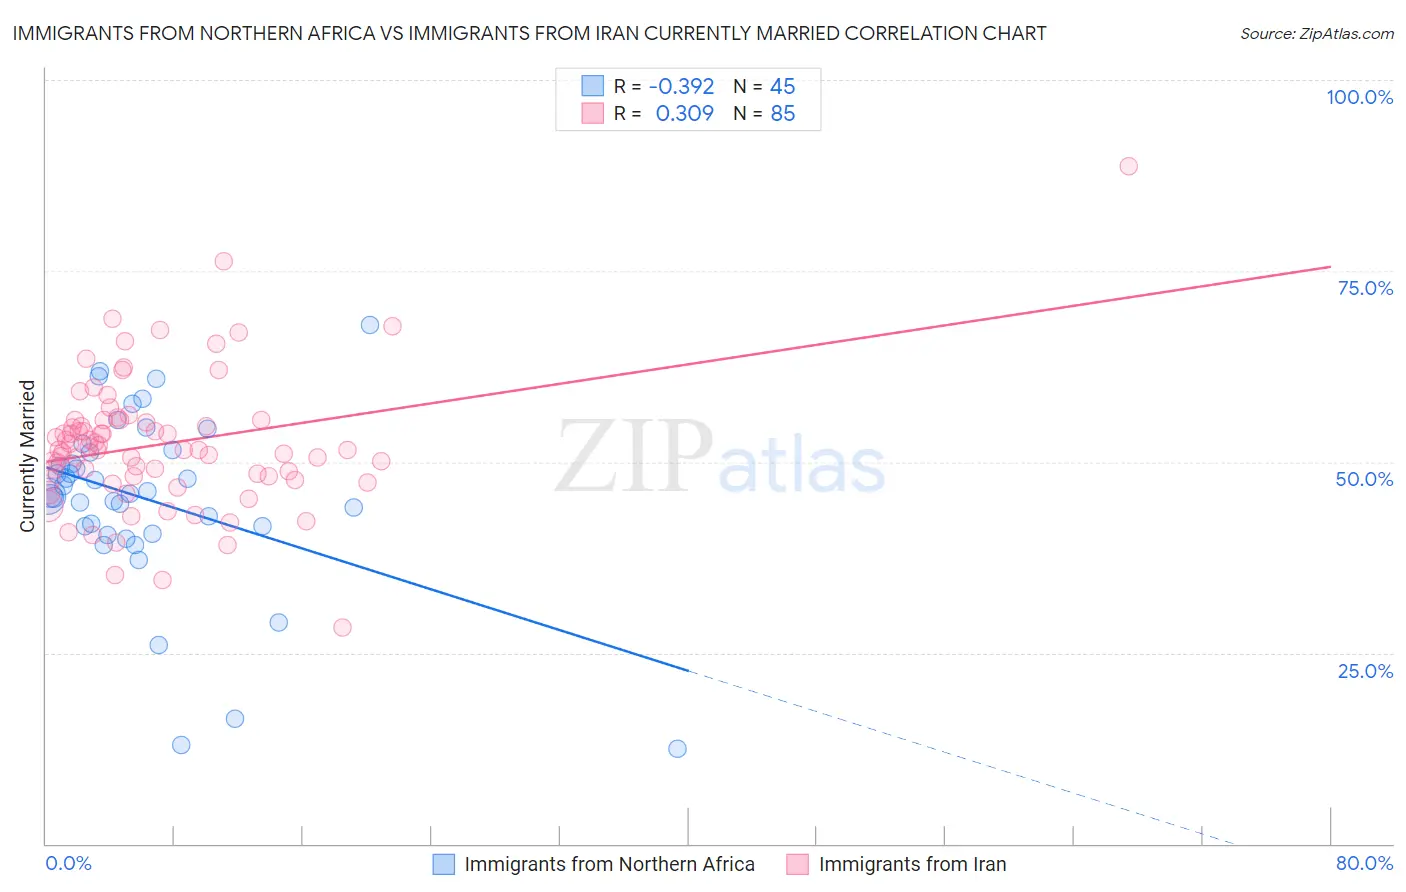
Immigrants from Northern Africa vs Immigrants from Iran Currently Married Correlation Chart
The statistical analysis conducted on geographies consisting of 321,174,675 people shows a mild negative correlation between the proportion of Immigrants from Northern Africa and percentage of population currently married in the United States with a correlation coefficient (R) of -0.392 and weighted average of 46.5%. Similarly, the statistical analysis conducted on geographies consisting of 279,835,322 people shows a mild positive correlation between the proportion of Immigrants from Iran and percentage of population currently married in the United States with a correlation coefficient (R) of 0.309 and weighted average of 48.7%, a difference of 4.9%.
Currently Married Correlation Summary
| Measurement | Immigrants from Northern Africa | Immigrants from Iran |
| Minimum | 12.5% | 28.3% |
| Maximum | 67.9% | 88.7% |
| Range | 55.4% | 60.4% |
| Mean | 45.1% | 52.3% |
| Median | 45.9% | 51.6% |
| Interquartile 25% (IQ1) | 41.1% | 47.9% |
| Interquartile 75% (IQ3) | 51.4% | 55.5% |
| Interquartile Range (IQR) | 10.3% | 7.6% |
| Standard Deviation (Sample) | 11.6% | 8.9% |
| Standard Deviation (Population) | 11.5% | 8.8% |
Similar Demographics by Currently Married
Demographics Similar to Immigrants from Northern Africa by Currently Married
In terms of currently married, the demographic groups most similar to Immigrants from Northern Africa are Brazilian (46.4%, a difference of 0.020%), Potawatomi (46.5%, a difference of 0.080%), Mongolian (46.4%, a difference of 0.080%), Immigrants from Chile (46.4%, a difference of 0.11%), and Ottawa (46.5%, a difference of 0.13%).
| Demographics | Rating | Rank | Currently Married |
| Hawaiians | 48.6 /100 | #176 | Average 46.6% |
| Israelis | 48.6 /100 | #177 | Average 46.6% |
| Chickasaw | 47.8 /100 | #178 | Average 46.6% |
| Immigrants | Oceania | 44.6 /100 | #179 | Average 46.5% |
| Costa Ricans | 43.7 /100 | #180 | Average 46.5% |
| Ottawa | 43.0 /100 | #181 | Average 46.5% |
| Potawatomi | 41.9 /100 | #182 | Average 46.5% |
| Immigrants | Northern Africa | 39.7 /100 | #183 | Fair 46.5% |
| Brazilians | 39.3 /100 | #184 | Fair 46.4% |
| Mongolians | 37.6 /100 | #185 | Fair 46.4% |
| Immigrants | Chile | 36.8 /100 | #186 | Fair 46.4% |
| Immigrants | Peru | 35.3 /100 | #187 | Fair 46.4% |
| Colombians | 31.8 /100 | #188 | Fair 46.3% |
| Fijians | 30.3 /100 | #189 | Fair 46.3% |
| Choctaw | 29.1 /100 | #190 | Fair 46.3% |
Demographics Similar to Immigrants from Iran by Currently Married
In terms of currently married, the demographic groups most similar to Immigrants from Iran are Northern European (48.7%, a difference of 0.010%), Austrian (48.7%, a difference of 0.020%), Belgian (48.7%, a difference of 0.030%), Immigrants from North America (48.7%, a difference of 0.060%), and Finnish (48.8%, a difference of 0.090%).
| Demographics | Rating | Rank | Currently Married |
| British | 99.4 /100 | #39 | Exceptional 48.8% |
| Immigrants | Canada | 99.4 /100 | #40 | Exceptional 48.8% |
| Greeks | 99.3 /100 | #41 | Exceptional 48.8% |
| Finns | 99.3 /100 | #42 | Exceptional 48.8% |
| Scotch-Irish | 99.3 /100 | #43 | Exceptional 48.7% |
| Immigrants | North America | 99.3 /100 | #44 | Exceptional 48.7% |
| Belgians | 99.3 /100 | #45 | Exceptional 48.7% |
| Immigrants | Iran | 99.2 /100 | #46 | Exceptional 48.7% |
| Northern Europeans | 99.2 /100 | #47 | Exceptional 48.7% |
| Austrians | 99.2 /100 | #48 | Exceptional 48.7% |
| Bhutanese | 99.1 /100 | #49 | Exceptional 48.6% |
| Iranians | 99.0 /100 | #50 | Exceptional 48.6% |
| Whites/Caucasians | 99.0 /100 | #51 | Exceptional 48.6% |
| Russians | 98.9 /100 | #52 | Exceptional 48.6% |
| Immigrants | Austria | 98.8 /100 | #53 | Exceptional 48.5% |