Uruguayan vs Immigrants from Switzerland Currently Married
COMPARE
Uruguayan
Immigrants from Switzerland
Currently Married
Currently Married Comparison
Uruguayans
Immigrants from Switzerland
45.6%
CURRENTLY MARRIED
7.9/ 100
METRIC RATING
210th/ 347
METRIC RANK
46.9%
CURRENTLY MARRIED
67.8/ 100
METRIC RATING
157th/ 347
METRIC RANK
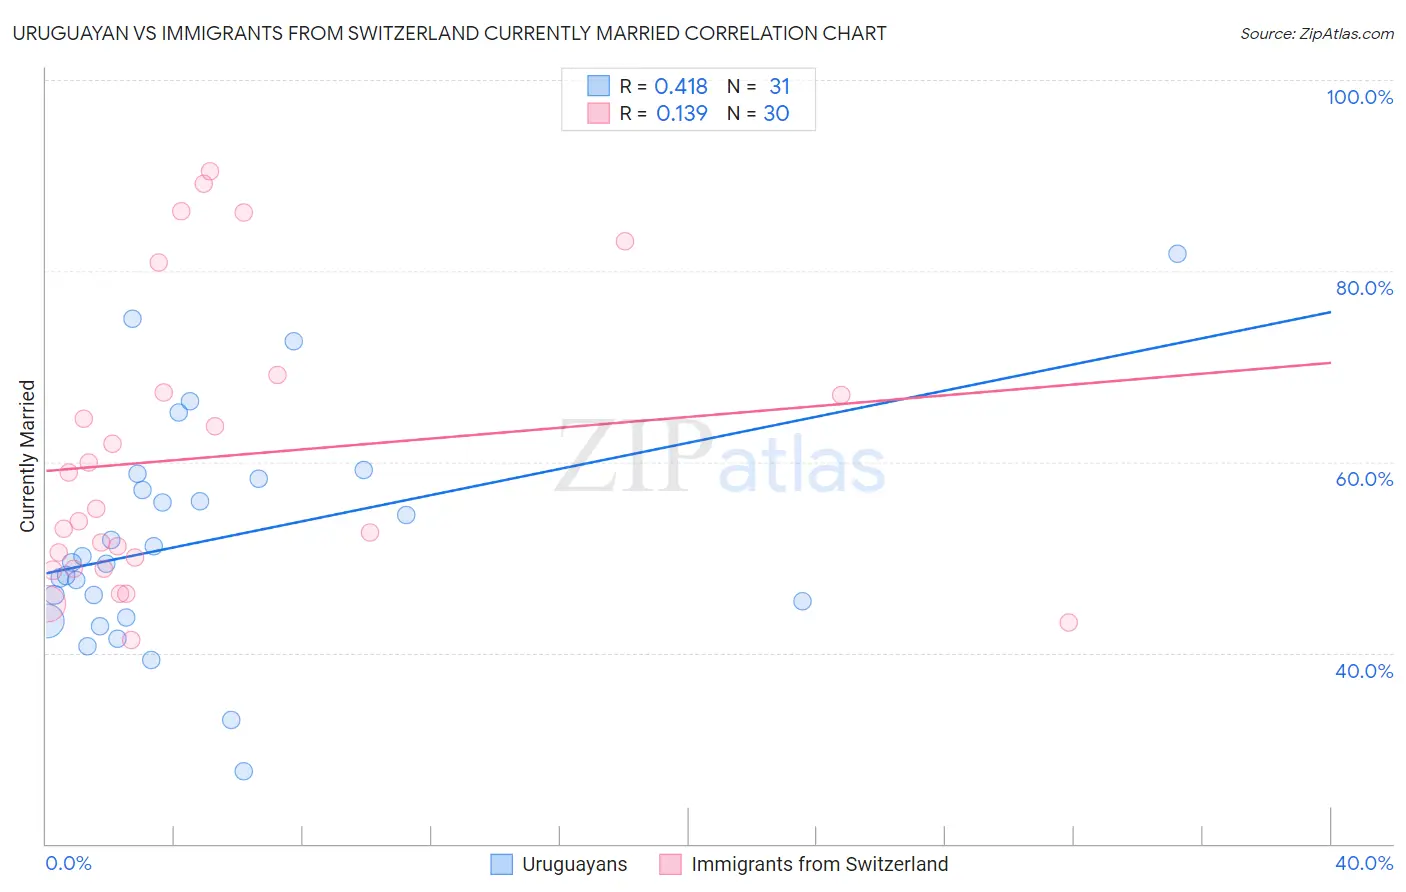
Uruguayan vs Immigrants from Switzerland Currently Married Correlation Chart
The statistical analysis conducted on geographies consisting of 144,776,099 people shows a moderate positive correlation between the proportion of Uruguayans and percentage of population currently married in the United States with a correlation coefficient (R) of 0.418 and weighted average of 45.6%. Similarly, the statistical analysis conducted on geographies consisting of 148,074,779 people shows a poor positive correlation between the proportion of Immigrants from Switzerland and percentage of population currently married in the United States with a correlation coefficient (R) of 0.139 and weighted average of 46.9%, a difference of 3.0%.
Currently Married Correlation Summary
| Measurement | Uruguayan | Immigrants from Switzerland |
| Minimum | 27.6% | 41.3% |
| Maximum | 81.8% | 90.4% |
| Range | 54.2% | 49.1% |
| Mean | 51.8% | 60.5% |
| Median | 49.5% | 54.4% |
| Interquartile 25% (IQ1) | 43.7% | 48.8% |
| Interquartile 75% (IQ3) | 58.2% | 67.3% |
| Interquartile Range (IQR) | 14.6% | 18.5% |
| Standard Deviation (Sample) | 11.8% | 14.9% |
| Standard Deviation (Population) | 11.6% | 14.7% |
Similar Demographics by Currently Married
Demographics Similar to Uruguayans by Currently Married
In terms of currently married, the demographic groups most similar to Uruguayans are Houma (45.5%, a difference of 0.090%), Marshallese (45.5%, a difference of 0.090%), Immigrants from Micronesia (45.6%, a difference of 0.11%), Alaska Native (45.5%, a difference of 0.12%), and Dutch West Indian (45.5%, a difference of 0.16%).
| Demographics | Rating | Rank | Currently Married |
| Taiwanese | 11.7 /100 | #203 | Poor 45.8% |
| Immigrants | Spain | 11.6 /100 | #204 | Poor 45.8% |
| South American Indians | 11.5 /100 | #205 | Poor 45.8% |
| Immigrants | Immigrants | 11.2 /100 | #206 | Poor 45.8% |
| Immigrants | South America | 10.8 /100 | #207 | Poor 45.7% |
| Alsatians | 10.8 /100 | #208 | Poor 45.7% |
| Immigrants | Micronesia | 8.8 /100 | #209 | Tragic 45.6% |
| Uruguayans | 7.9 /100 | #210 | Tragic 45.6% |
| Houma | 7.2 /100 | #211 | Tragic 45.5% |
| Marshallese | 7.2 /100 | #212 | Tragic 45.5% |
| Alaska Natives | 7.0 /100 | #213 | Tragic 45.5% |
| Dutch West Indians | 6.7 /100 | #214 | Tragic 45.5% |
| German Russians | 6.7 /100 | #215 | Tragic 45.5% |
| Immigrants | Morocco | 5.5 /100 | #216 | Tragic 45.4% |
| Immigrants | Thailand | 5.1 /100 | #217 | Tragic 45.4% |
Demographics Similar to Immigrants from Switzerland by Currently Married
In terms of currently married, the demographic groups most similar to Immigrants from Switzerland are Spanish (47.0%, a difference of 0.010%), Immigrants from Venezuela (47.0%, a difference of 0.030%), Albanian (47.0%, a difference of 0.030%), Arab (47.0%, a difference of 0.030%), and Immigrants from Serbia (47.0%, a difference of 0.040%).
| Demographics | Rating | Rank | Currently Married |
| Immigrants | Turkey | 70.0 /100 | #150 | Good 47.0% |
| Chileans | 69.8 /100 | #151 | Good 47.0% |
| Immigrants | Serbia | 68.8 /100 | #152 | Good 47.0% |
| Immigrants | Venezuela | 68.6 /100 | #153 | Good 47.0% |
| Albanians | 68.6 /100 | #154 | Good 47.0% |
| Arabs | 68.6 /100 | #155 | Good 47.0% |
| Spanish | 68.1 /100 | #156 | Good 47.0% |
| Immigrants | Switzerland | 67.8 /100 | #157 | Good 46.9% |
| Cherokee | 66.8 /100 | #158 | Good 46.9% |
| Iraqis | 66.4 /100 | #159 | Good 46.9% |
| Immigrants | Uzbekistan | 66.0 /100 | #160 | Good 46.9% |
| Immigrants | Southern Europe | 65.9 /100 | #161 | Good 46.9% |
| Immigrants | Nonimmigrants | 65.4 /100 | #162 | Good 46.9% |
| Delaware | 64.7 /100 | #163 | Good 46.9% |
| Immigrants | Western Asia | 64.2 /100 | #164 | Good 46.9% |