Turkish vs Bolivian Child Poverty Under the Age of 5
COMPARE
Turkish
Bolivian
Child Poverty Under the Age of 5
Child Poverty Under the Age of 5 Comparison
Turks
Bolivians
14.6%
CHILD POVERTY UNDER THE AGE OF 5
99.7/ 100
METRIC RATING
37th/ 347
METRIC RANK
13.8%
CHILD POVERTY UNDER THE AGE OF 5
100.0/ 100
METRIC RATING
21st/ 347
METRIC RANK
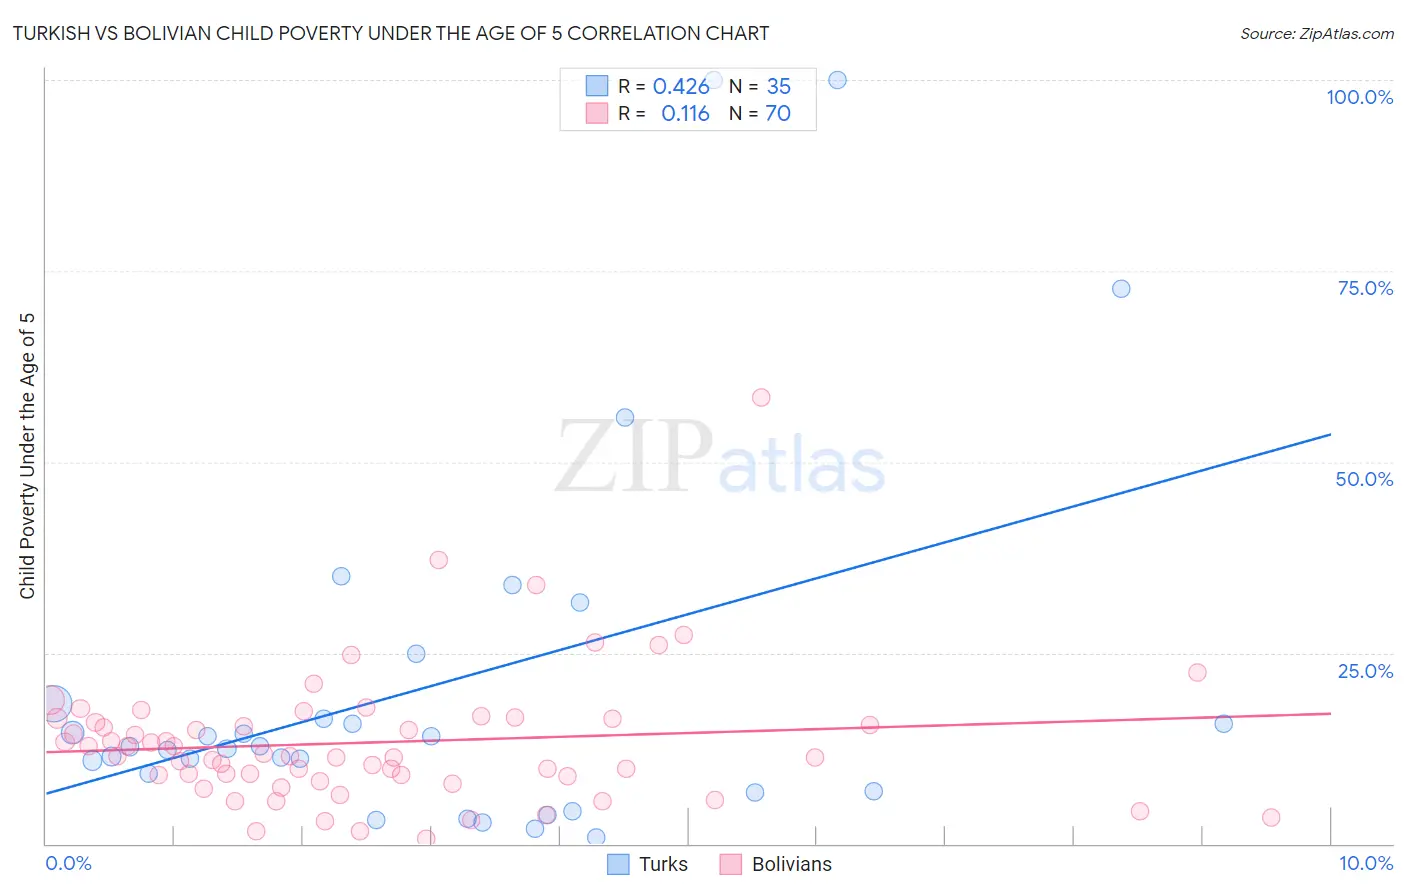
Turkish vs Bolivian Child Poverty Under the Age of 5 Correlation Chart
The statistical analysis conducted on geographies consisting of 261,582,938 people shows a moderate positive correlation between the proportion of Turks and poverty level among children under the age of 5 in the United States with a correlation coefficient (R) of 0.426 and weighted average of 14.6%. Similarly, the statistical analysis conducted on geographies consisting of 180,561,858 people shows a poor positive correlation between the proportion of Bolivians and poverty level among children under the age of 5 in the United States with a correlation coefficient (R) of 0.116 and weighted average of 13.8%, a difference of 5.4%.
Child Poverty Under the Age of 5 Correlation Summary
| Measurement | Turkish | Bolivian |
| Minimum | 0.87% | 0.67% |
| Maximum | 100.0% | 58.4% |
| Range | 99.1% | 57.8% |
| Mean | 20.7% | 13.3% |
| Median | 12.7% | 11.4% |
| Interquartile 25% (IQ1) | 6.9% | 8.8% |
| Interquartile 75% (IQ3) | 18.3% | 16.4% |
| Interquartile Range (IQR) | 11.4% | 7.5% |
| Standard Deviation (Sample) | 24.7% | 9.0% |
| Standard Deviation (Population) | 24.3% | 8.9% |
Demographics Similar to Turks and Bolivians by Child Poverty Under the Age of 5
In terms of child poverty under the age of 5, the demographic groups most similar to Turks are Eastern European (14.6%, a difference of 0.27%), Norwegian (14.6%, a difference of 0.27%), Maltese (14.5%, a difference of 0.34%), Latvian (14.5%, a difference of 0.41%), and Immigrants from Moldova (14.5%, a difference of 0.42%). Similarly, the demographic groups most similar to Bolivians are Immigrants from Bolivia (13.8%, a difference of 0.080%), Immigrants from Japan (13.8%, a difference of 0.30%), Bulgarian (13.9%, a difference of 0.52%), Immigrants from Ireland (13.7%, a difference of 0.70%), and Asian (14.0%, a difference of 1.0%).
| Demographics | Rating | Rank | Child Poverty Under the Age of 5 |
| Immigrants | Ireland | 100.0 /100 | #19 | Exceptional 13.7% |
| Immigrants | Japan | 100.0 /100 | #20 | Exceptional 13.8% |
| Bolivians | 100.0 /100 | #21 | Exceptional 13.8% |
| Immigrants | Bolivia | 100.0 /100 | #22 | Exceptional 13.8% |
| Bulgarians | 99.9 /100 | #23 | Exceptional 13.9% |
| Asians | 99.9 /100 | #24 | Exceptional 14.0% |
| Cypriots | 99.9 /100 | #25 | Exceptional 14.0% |
| Immigrants | Lithuania | 99.9 /100 | #26 | Exceptional 14.1% |
| Tongans | 99.9 /100 | #27 | Exceptional 14.2% |
| Immigrants | Indonesia | 99.8 /100 | #28 | Exceptional 14.3% |
| Immigrants | Asia | 99.8 /100 | #29 | Exceptional 14.4% |
| Cambodians | 99.8 /100 | #30 | Exceptional 14.4% |
| Koreans | 99.8 /100 | #31 | Exceptional 14.4% |
| Immigrants | Sri Lanka | 99.8 /100 | #32 | Exceptional 14.4% |
| Taiwanese | 99.8 /100 | #33 | Exceptional 14.5% |
| Immigrants | Moldova | 99.8 /100 | #34 | Exceptional 14.5% |
| Latvians | 99.8 /100 | #35 | Exceptional 14.5% |
| Maltese | 99.8 /100 | #36 | Exceptional 14.5% |
| Turks | 99.7 /100 | #37 | Exceptional 14.6% |
| Eastern Europeans | 99.7 /100 | #38 | Exceptional 14.6% |
| Norwegians | 99.7 /100 | #39 | Exceptional 14.6% |