Immigrants from Thailand vs Bolivian Average Family Size
COMPARE
Immigrants from Thailand
Bolivian
Average Family Size
Average Family Size Comparison
Immigrants from Thailand
Bolivians
3.27
AVERAGE FAMILY SIZE
93.3/ 100
METRIC RATING
121st/ 347
METRIC RANK
3.29
AVERAGE FAMILY SIZE
98.3/ 100
METRIC RATING
104th/ 347
METRIC RANK
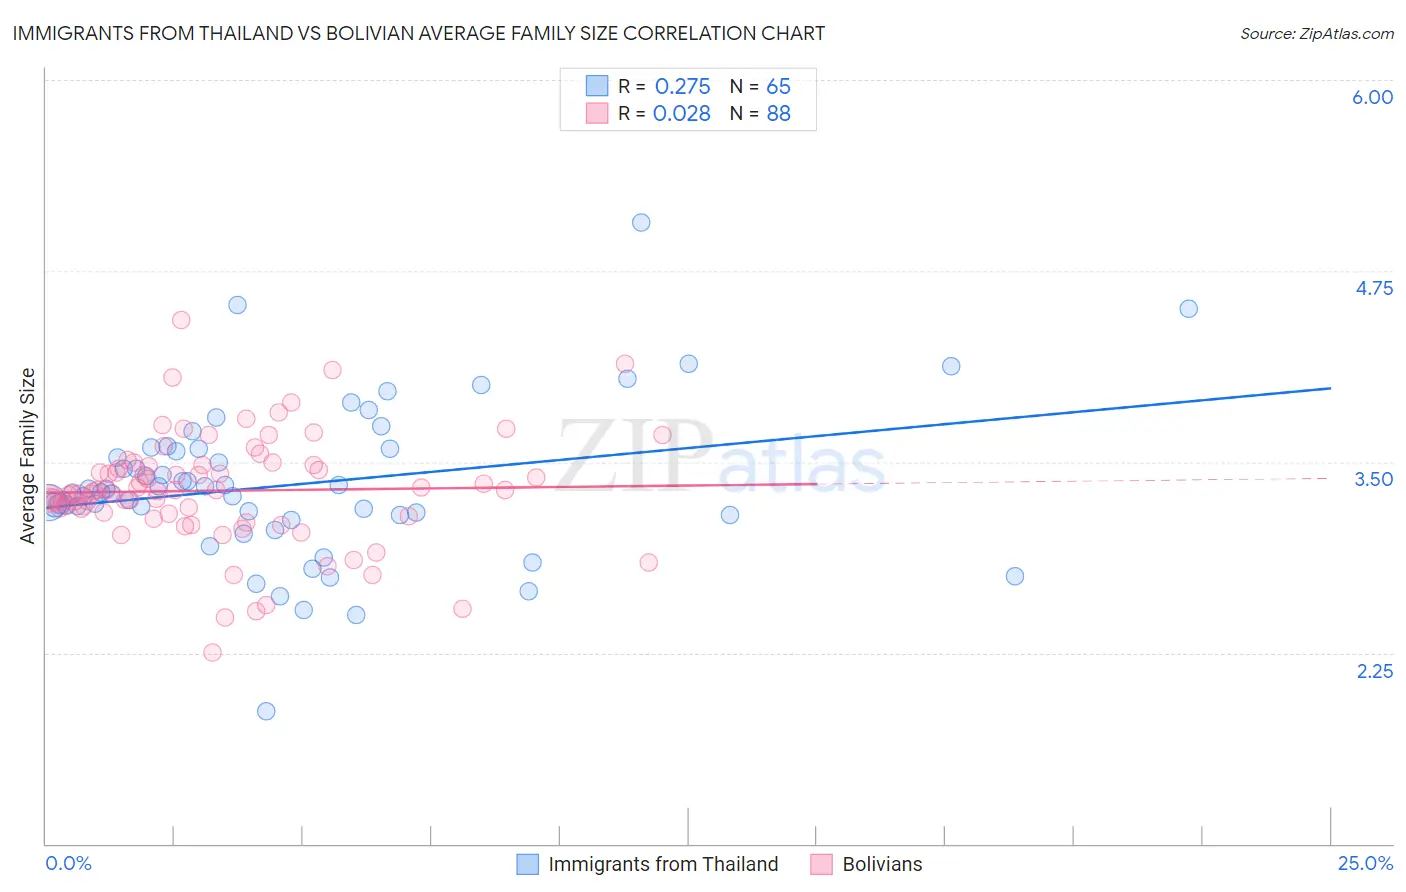
Immigrants from Thailand vs Bolivian Average Family Size Correlation Chart
The statistical analysis conducted on geographies consisting of 316,926,842 people shows a weak positive correlation between the proportion of Immigrants from Thailand and average family size in the United States with a correlation coefficient (R) of 0.275 and weighted average of 3.27. Similarly, the statistical analysis conducted on geographies consisting of 184,628,793 people shows no correlation between the proportion of Bolivians and average family size in the United States with a correlation coefficient (R) of 0.028 and weighted average of 3.29, a difference of 0.65%.
Average Family Size Correlation Summary
| Measurement | Immigrants from Thailand | Bolivian |
| Minimum | 1.87 | 2.25 |
| Maximum | 5.07 | 4.43 |
| Range | 3.20 | 2.18 |
| Mean | 3.35 | 3.31 |
| Median | 3.30 | 3.31 |
| Interquartile 25% (IQ1) | 3.15 | 3.16 |
| Interquartile 75% (IQ3) | 3.59 | 3.47 |
| Interquartile Range (IQR) | 0.44 | 0.31 |
| Standard Deviation (Sample) | 0.51 | 0.36 |
| Standard Deviation (Population) | 0.51 | 0.36 |
Demographics Similar to Immigrants from Thailand and Bolivians by Average Family Size
In terms of average family size, the demographic groups most similar to Immigrants from Thailand are Immigrants from Bahamas (3.27, a difference of 0.020%), Immigrants from Colombia (3.27, a difference of 0.030%), Immigrants from Indonesia (3.27, a difference of 0.040%), Immigrants from Asia (3.27, a difference of 0.050%), and Kiowa (3.27, a difference of 0.12%). Similarly, the demographic groups most similar to Bolivians are Immigrants from Western Africa (3.29, a difference of 0.040%), Immigrants from Ghana (3.29, a difference of 0.050%), West Indian (3.29, a difference of 0.070%), Paiute (3.29, a difference of 0.070%), and Ghanaian (3.29, a difference of 0.090%).
| Demographics | Rating | Rank | Average Family Size |
| West Indians | 98.5 /100 | #102 | Exceptional 3.29 |
| Immigrants | Western Africa | 98.4 /100 | #103 | Exceptional 3.29 |
| Bolivians | 98.3 /100 | #104 | Exceptional 3.29 |
| Immigrants | Ghana | 98.1 /100 | #105 | Exceptional 3.29 |
| Paiute | 98.0 /100 | #106 | Exceptional 3.29 |
| Ghanaians | 98.0 /100 | #107 | Exceptional 3.29 |
| Asians | 97.0 /100 | #108 | Exceptional 3.28 |
| Puerto Ricans | 96.7 /100 | #109 | Exceptional 3.28 |
| Bahamians | 96.6 /100 | #110 | Exceptional 3.28 |
| Indonesians | 96.2 /100 | #111 | Exceptional 3.28 |
| Blacks/African Americans | 95.7 /100 | #112 | Exceptional 3.27 |
| Immigrants | Panama | 95.6 /100 | #113 | Exceptional 3.27 |
| South Americans | 95.1 /100 | #114 | Exceptional 3.27 |
| Immigrants | Liberia | 95.0 /100 | #115 | Exceptional 3.27 |
| Immigrants | South America | 95.0 /100 | #116 | Exceptional 3.27 |
| Kiowa | 94.8 /100 | #117 | Exceptional 3.27 |
| Immigrants | Asia | 94.0 /100 | #118 | Exceptional 3.27 |
| Immigrants | Indonesia | 93.7 /100 | #119 | Exceptional 3.27 |
| Immigrants | Bahamas | 93.6 /100 | #120 | Exceptional 3.27 |
| Immigrants | Thailand | 93.3 /100 | #121 | Exceptional 3.27 |
| Immigrants | Colombia | 92.8 /100 | #122 | Exceptional 3.27 |