Immigrants from Micronesia vs Australian Average Family Size
COMPARE
Immigrants from Micronesia
Australian
Average Family Size
Average Family Size Comparison
Immigrants from Micronesia
Australians
3.32
AVERAGE FAMILY SIZE
99.8/ 100
METRIC RATING
78th/ 347
METRIC RANK
3.13
AVERAGE FAMILY SIZE
0.1/ 100
METRIC RATING
305th/ 347
METRIC RANK
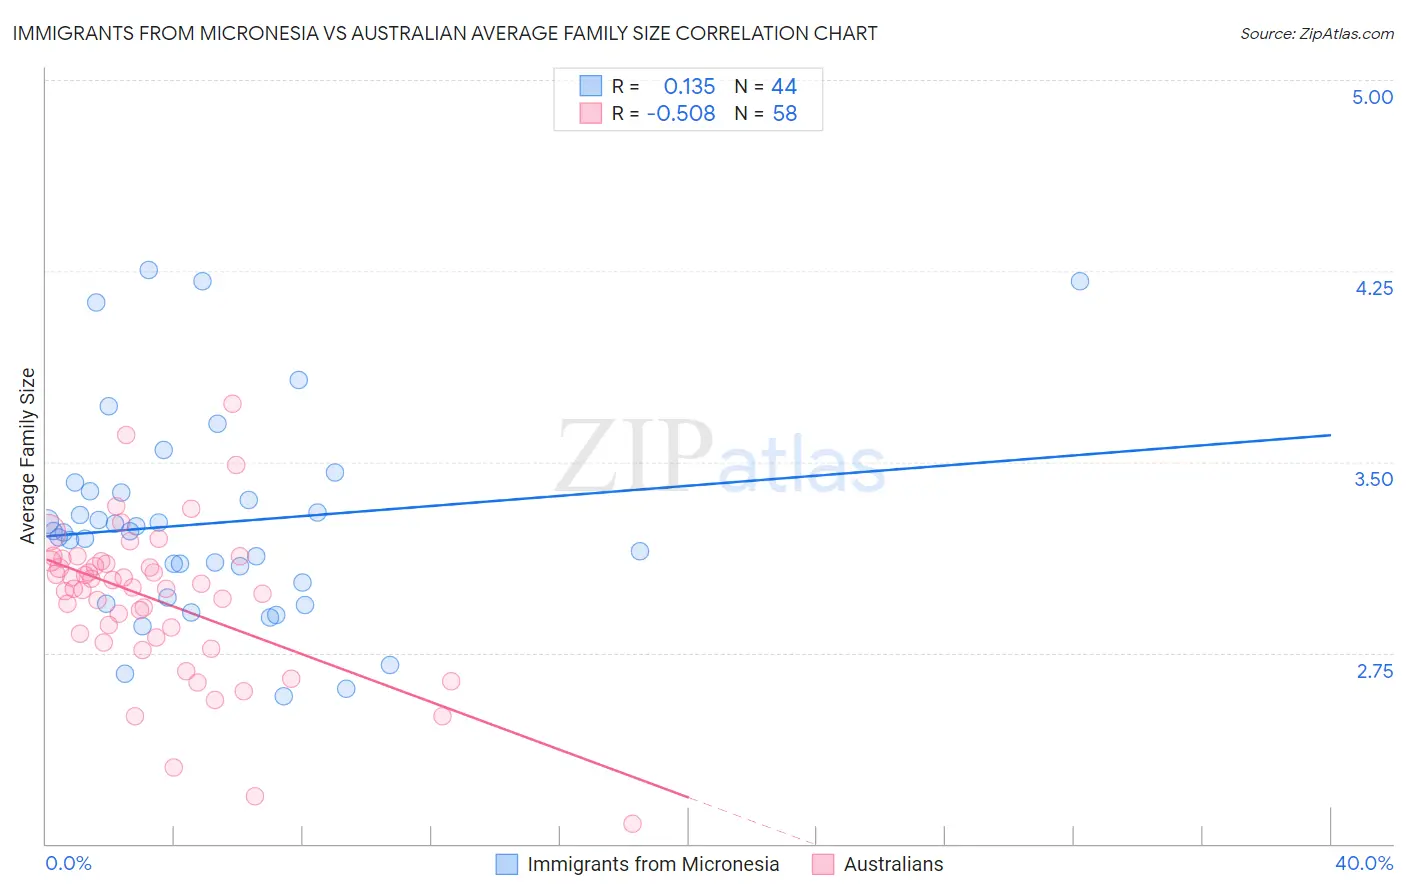
Immigrants from Micronesia vs Australian Average Family Size Correlation Chart
The statistical analysis conducted on geographies consisting of 61,601,070 people shows a poor positive correlation between the proportion of Immigrants from Micronesia and average family size in the United States with a correlation coefficient (R) of 0.135 and weighted average of 3.32. Similarly, the statistical analysis conducted on geographies consisting of 224,034,601 people shows a substantial negative correlation between the proportion of Australians and average family size in the United States with a correlation coefficient (R) of -0.508 and weighted average of 3.13, a difference of 6.0%.
Average Family Size Correlation Summary
| Measurement | Immigrants from Micronesia | Australian |
| Minimum | 2.58 | 2.08 |
| Maximum | 4.26 | 3.73 |
| Range | 1.68 | 1.65 |
| Mean | 3.26 | 2.96 |
| Median | 3.22 | 3.00 |
| Interquartile 25% (IQ1) | 3.00 | 2.81 |
| Interquartile 75% (IQ3) | 3.38 | 3.11 |
| Interquartile Range (IQR) | 0.39 | 0.30 |
| Standard Deviation (Sample) | 0.40 | 0.30 |
| Standard Deviation (Population) | 0.40 | 0.30 |
Similar Demographics by Average Family Size
Demographics Similar to Immigrants from Micronesia by Average Family Size
In terms of average family size, the demographic groups most similar to Immigrants from Micronesia are British West Indian (3.32, a difference of 0.010%), Lumbee (3.32, a difference of 0.030%), Immigrants from Ecuador (3.32, a difference of 0.040%), Trinidadian and Tobagonian (3.32, a difference of 0.050%), and Immigrants from Barbados (3.32, a difference of 0.070%).
| Demographics | Rating | Rank | Average Family Size |
| Immigrants | West Indies | 99.9 /100 | #71 | Exceptional 3.33 |
| Immigrants | Caribbean | 99.9 /100 | #72 | Exceptional 3.33 |
| Yaqui | 99.9 /100 | #73 | Exceptional 3.32 |
| Immigrants | Sierra Leone | 99.9 /100 | #74 | Exceptional 3.32 |
| Immigrants | Barbados | 99.8 /100 | #75 | Exceptional 3.32 |
| Trinidadians and Tobagonians | 99.8 /100 | #76 | Exceptional 3.32 |
| Immigrants | Ecuador | 99.8 /100 | #77 | Exceptional 3.32 |
| Immigrants | Micronesia | 99.8 /100 | #78 | Exceptional 3.32 |
| British West Indians | 99.8 /100 | #79 | Exceptional 3.32 |
| Lumbee | 99.8 /100 | #80 | Exceptional 3.32 |
| Immigrants | Dominica | 99.8 /100 | #81 | Exceptional 3.32 |
| Ecuadorians | 99.8 /100 | #82 | Exceptional 3.32 |
| Immigrants | Afghanistan | 99.8 /100 | #83 | Exceptional 3.32 |
| Immigrants | Nigeria | 99.7 /100 | #84 | Exceptional 3.32 |
| Afghans | 99.7 /100 | #85 | Exceptional 3.31 |
Demographics Similar to Australians by Average Family Size
In terms of average family size, the demographic groups most similar to Australians are Immigrants from Switzerland (3.13, a difference of 0.030%), Immigrants from Latvia (3.13, a difference of 0.050%), British (3.13, a difference of 0.050%), Macedonian (3.13, a difference of 0.060%), and Immigrants from Ireland (3.13, a difference of 0.070%).
| Demographics | Rating | Rank | Average Family Size |
| Colville | 0.2 /100 | #298 | Tragic 3.14 |
| Canadians | 0.2 /100 | #299 | Tragic 3.14 |
| Immigrants | Sweden | 0.2 /100 | #300 | Tragic 3.14 |
| Macedonians | 0.2 /100 | #301 | Tragic 3.13 |
| Immigrants | Latvia | 0.2 /100 | #302 | Tragic 3.13 |
| British | 0.2 /100 | #303 | Tragic 3.13 |
| Immigrants | Switzerland | 0.2 /100 | #304 | Tragic 3.13 |
| Australians | 0.1 /100 | #305 | Tragic 3.13 |
| Immigrants | Ireland | 0.1 /100 | #306 | Tragic 3.13 |
| Immigrants | Serbia | 0.1 /100 | #307 | Tragic 3.13 |
| Slavs | 0.1 /100 | #308 | Tragic 3.13 |
| Northern Europeans | 0.1 /100 | #309 | Tragic 3.13 |
| Czechoslovakians | 0.1 /100 | #310 | Tragic 3.13 |
| Immigrants | Northern Europe | 0.1 /100 | #311 | Tragic 3.13 |
| Immigrants | Australia | 0.1 /100 | #312 | Tragic 3.13 |