Immigrants from North Macedonia vs Australian Average Family Size
COMPARE
Immigrants from North Macedonia
Australian
Average Family Size
Average Family Size Comparison
Immigrants from North Macedonia
Australians
3.16
AVERAGE FAMILY SIZE
1.3/ 100
METRIC RATING
261st/ 347
METRIC RANK
3.13
AVERAGE FAMILY SIZE
0.1/ 100
METRIC RATING
305th/ 347
METRIC RANK
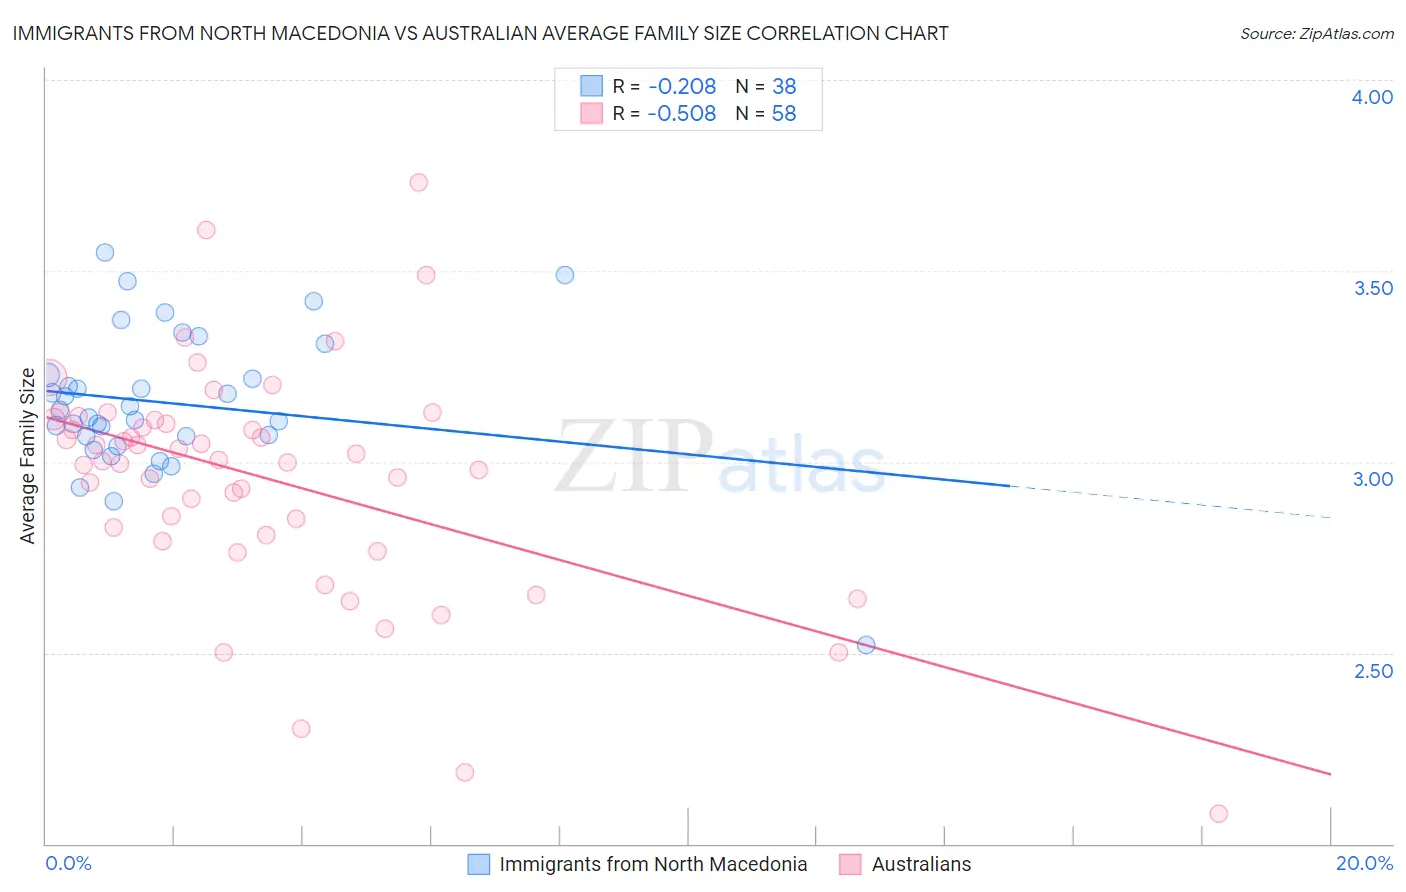
Immigrants from North Macedonia vs Australian Average Family Size Correlation Chart
The statistical analysis conducted on geographies consisting of 74,306,697 people shows a weak negative correlation between the proportion of Immigrants from North Macedonia and average family size in the United States with a correlation coefficient (R) of -0.208 and weighted average of 3.16. Similarly, the statistical analysis conducted on geographies consisting of 224,034,601 people shows a substantial negative correlation between the proportion of Australians and average family size in the United States with a correlation coefficient (R) of -0.508 and weighted average of 3.13, a difference of 1.0%.
Average Family Size Correlation Summary
| Measurement | Immigrants from North Macedonia | Australian |
| Minimum | 2.52 | 2.08 |
| Maximum | 3.55 | 3.73 |
| Range | 1.03 | 1.65 |
| Mean | 3.15 | 2.96 |
| Median | 3.13 | 3.00 |
| Interquartile 25% (IQ1) | 3.07 | 2.81 |
| Interquartile 75% (IQ3) | 3.23 | 3.11 |
| Interquartile Range (IQR) | 0.16 | 0.30 |
| Standard Deviation (Sample) | 0.19 | 0.30 |
| Standard Deviation (Population) | 0.19 | 0.30 |
Similar Demographics by Average Family Size
Demographics Similar to Immigrants from North Macedonia by Average Family Size
In terms of average family size, the demographic groups most similar to Immigrants from North Macedonia are Turkish (3.16, a difference of 0.010%), Potawatomi (3.16, a difference of 0.010%), Immigrants from Albania (3.16, a difference of 0.010%), Immigrants from Russia (3.16, a difference of 0.010%), and Albanian (3.17, a difference of 0.060%).
| Demographics | Rating | Rank | Average Family Size |
| Immigrants | Hungary | 1.7 /100 | #254 | Tragic 3.17 |
| Cape Verdeans | 1.6 /100 | #255 | Tragic 3.17 |
| Immigrants | Kazakhstan | 1.5 /100 | #256 | Tragic 3.17 |
| Albanians | 1.5 /100 | #257 | Tragic 3.17 |
| Turks | 1.3 /100 | #258 | Tragic 3.16 |
| Potawatomi | 1.3 /100 | #259 | Tragic 3.16 |
| Immigrants | Albania | 1.3 /100 | #260 | Tragic 3.16 |
| Immigrants | North Macedonia | 1.3 /100 | #261 | Tragic 3.16 |
| Immigrants | Russia | 1.3 /100 | #262 | Tragic 3.16 |
| Immigrants | Bulgaria | 1.0 /100 | #263 | Tragic 3.16 |
| Americans | 1.0 /100 | #264 | Tragic 3.16 |
| Immigrants | South Africa | 0.9 /100 | #265 | Tragic 3.16 |
| Immigrants | Greece | 0.9 /100 | #266 | Tragic 3.16 |
| Iroquois | 0.8 /100 | #267 | Tragic 3.16 |
| Maltese | 0.8 /100 | #268 | Tragic 3.16 |
Demographics Similar to Australians by Average Family Size
In terms of average family size, the demographic groups most similar to Australians are Immigrants from Switzerland (3.13, a difference of 0.030%), Immigrants from Latvia (3.13, a difference of 0.050%), British (3.13, a difference of 0.050%), Macedonian (3.13, a difference of 0.060%), and Immigrants from Ireland (3.13, a difference of 0.070%).
| Demographics | Rating | Rank | Average Family Size |
| Colville | 0.2 /100 | #298 | Tragic 3.14 |
| Canadians | 0.2 /100 | #299 | Tragic 3.14 |
| Immigrants | Sweden | 0.2 /100 | #300 | Tragic 3.14 |
| Macedonians | 0.2 /100 | #301 | Tragic 3.13 |
| Immigrants | Latvia | 0.2 /100 | #302 | Tragic 3.13 |
| British | 0.2 /100 | #303 | Tragic 3.13 |
| Immigrants | Switzerland | 0.2 /100 | #304 | Tragic 3.13 |
| Australians | 0.1 /100 | #305 | Tragic 3.13 |
| Immigrants | Ireland | 0.1 /100 | #306 | Tragic 3.13 |
| Immigrants | Serbia | 0.1 /100 | #307 | Tragic 3.13 |
| Slavs | 0.1 /100 | #308 | Tragic 3.13 |
| Northern Europeans | 0.1 /100 | #309 | Tragic 3.13 |
| Czechoslovakians | 0.1 /100 | #310 | Tragic 3.13 |
| Immigrants | Northern Europe | 0.1 /100 | #311 | Tragic 3.13 |
| Immigrants | Australia | 0.1 /100 | #312 | Tragic 3.13 |