Polish vs Australian Average Family Size
COMPARE
Polish
Australian
Average Family Size
Average Family Size Comparison
Poles
Australians
3.09
AVERAGE FAMILY SIZE
0.0/ 100
METRIC RATING
341st/ 347
METRIC RANK
3.13
AVERAGE FAMILY SIZE
0.1/ 100
METRIC RATING
305th/ 347
METRIC RANK
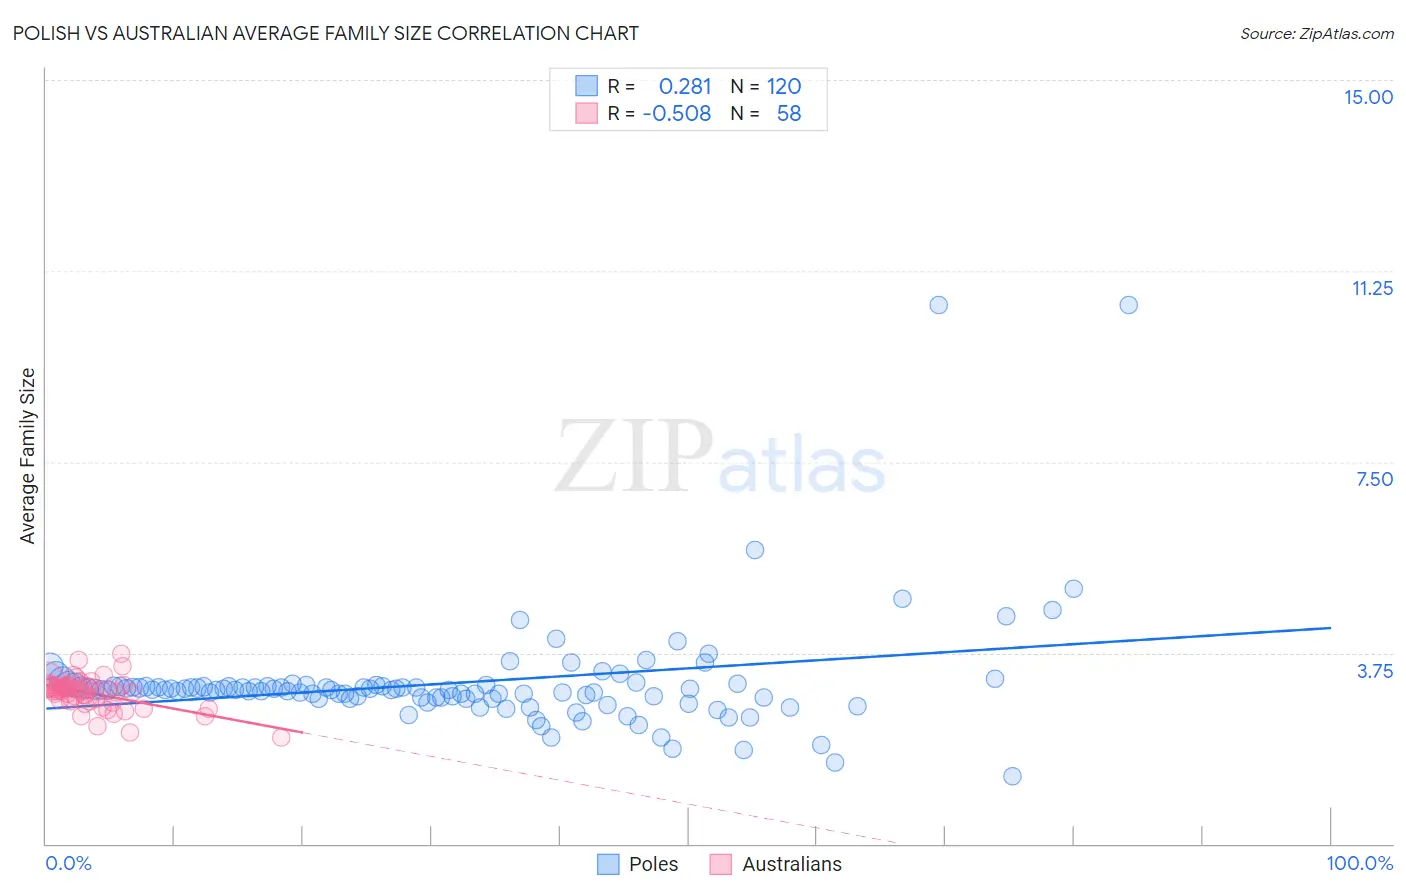
Polish vs Australian Average Family Size Correlation Chart
The statistical analysis conducted on geographies consisting of 559,976,913 people shows a weak positive correlation between the proportion of Poles and average family size in the United States with a correlation coefficient (R) of 0.281 and weighted average of 3.09. Similarly, the statistical analysis conducted on geographies consisting of 224,034,601 people shows a substantial negative correlation between the proportion of Australians and average family size in the United States with a correlation coefficient (R) of -0.508 and weighted average of 3.13, a difference of 1.3%.
Average Family Size Correlation Summary
| Measurement | Polish | Australian |
| Minimum | 1.32 | 2.08 |
| Maximum | 10.58 | 3.73 |
| Range | 9.26 | 1.65 |
| Mean | 3.15 | 2.96 |
| Median | 3.03 | 3.00 |
| Interquartile 25% (IQ1) | 2.87 | 2.81 |
| Interquartile 75% (IQ3) | 3.10 | 3.11 |
| Interquartile Range (IQR) | 0.23 | 0.30 |
| Standard Deviation (Sample) | 1.13 | 0.30 |
| Standard Deviation (Population) | 1.13 | 0.30 |
Similar Demographics by Average Family Size
Demographics Similar to Poles by Average Family Size
In terms of average family size, the demographic groups most similar to Poles are Finnish (3.09, a difference of 0.050%), German (3.09, a difference of 0.14%), Croatian (3.10, a difference of 0.19%), French (3.10, a difference of 0.21%), and Swedish (3.10, a difference of 0.23%).
| Demographics | Rating | Rank | Average Family Size |
| Estonians | 0.0 /100 | #333 | Tragic 3.10 |
| Lithuanians | 0.0 /100 | #334 | Tragic 3.10 |
| Luxembourgers | 0.0 /100 | #335 | Tragic 3.10 |
| Irish | 0.0 /100 | #336 | Tragic 3.10 |
| Swedes | 0.0 /100 | #337 | Tragic 3.10 |
| French | 0.0 /100 | #338 | Tragic 3.10 |
| Croatians | 0.0 /100 | #339 | Tragic 3.10 |
| Finns | 0.0 /100 | #340 | Tragic 3.09 |
| Poles | 0.0 /100 | #341 | Tragic 3.09 |
| Germans | 0.0 /100 | #342 | Tragic 3.09 |
| Norwegians | 0.0 /100 | #343 | Tragic 3.08 |
| French Canadians | 0.0 /100 | #344 | Tragic 3.07 |
| Slovenes | 0.0 /100 | #345 | Tragic 3.07 |
| Slovaks | 0.0 /100 | #346 | Tragic 3.06 |
| Carpatho Rusyns | 0.0 /100 | #347 | Tragic 3.06 |
Demographics Similar to Australians by Average Family Size
In terms of average family size, the demographic groups most similar to Australians are Immigrants from Switzerland (3.13, a difference of 0.030%), Immigrants from Latvia (3.13, a difference of 0.050%), British (3.13, a difference of 0.050%), Macedonian (3.13, a difference of 0.060%), and Immigrants from Ireland (3.13, a difference of 0.070%).
| Demographics | Rating | Rank | Average Family Size |
| Colville | 0.2 /100 | #298 | Tragic 3.14 |
| Canadians | 0.2 /100 | #299 | Tragic 3.14 |
| Immigrants | Sweden | 0.2 /100 | #300 | Tragic 3.14 |
| Macedonians | 0.2 /100 | #301 | Tragic 3.13 |
| Immigrants | Latvia | 0.2 /100 | #302 | Tragic 3.13 |
| British | 0.2 /100 | #303 | Tragic 3.13 |
| Immigrants | Switzerland | 0.2 /100 | #304 | Tragic 3.13 |
| Australians | 0.1 /100 | #305 | Tragic 3.13 |
| Immigrants | Ireland | 0.1 /100 | #306 | Tragic 3.13 |
| Immigrants | Serbia | 0.1 /100 | #307 | Tragic 3.13 |
| Slavs | 0.1 /100 | #308 | Tragic 3.13 |
| Northern Europeans | 0.1 /100 | #309 | Tragic 3.13 |
| Czechoslovakians | 0.1 /100 | #310 | Tragic 3.13 |
| Immigrants | Northern Europe | 0.1 /100 | #311 | Tragic 3.13 |
| Immigrants | Australia | 0.1 /100 | #312 | Tragic 3.13 |