Tongan vs Colombian Single Mother Households
COMPARE
Tongan
Colombian
Single Mother Households
Single Mother Households Comparison
Tongans
Colombians
5.8%
SINGLE MOTHER HOUSEHOLDS
93.7/ 100
METRIC RATING
120th/ 347
METRIC RANK
6.6%
SINGLE MOTHER HOUSEHOLDS
18.3/ 100
METRIC RATING
193rd/ 347
METRIC RANK
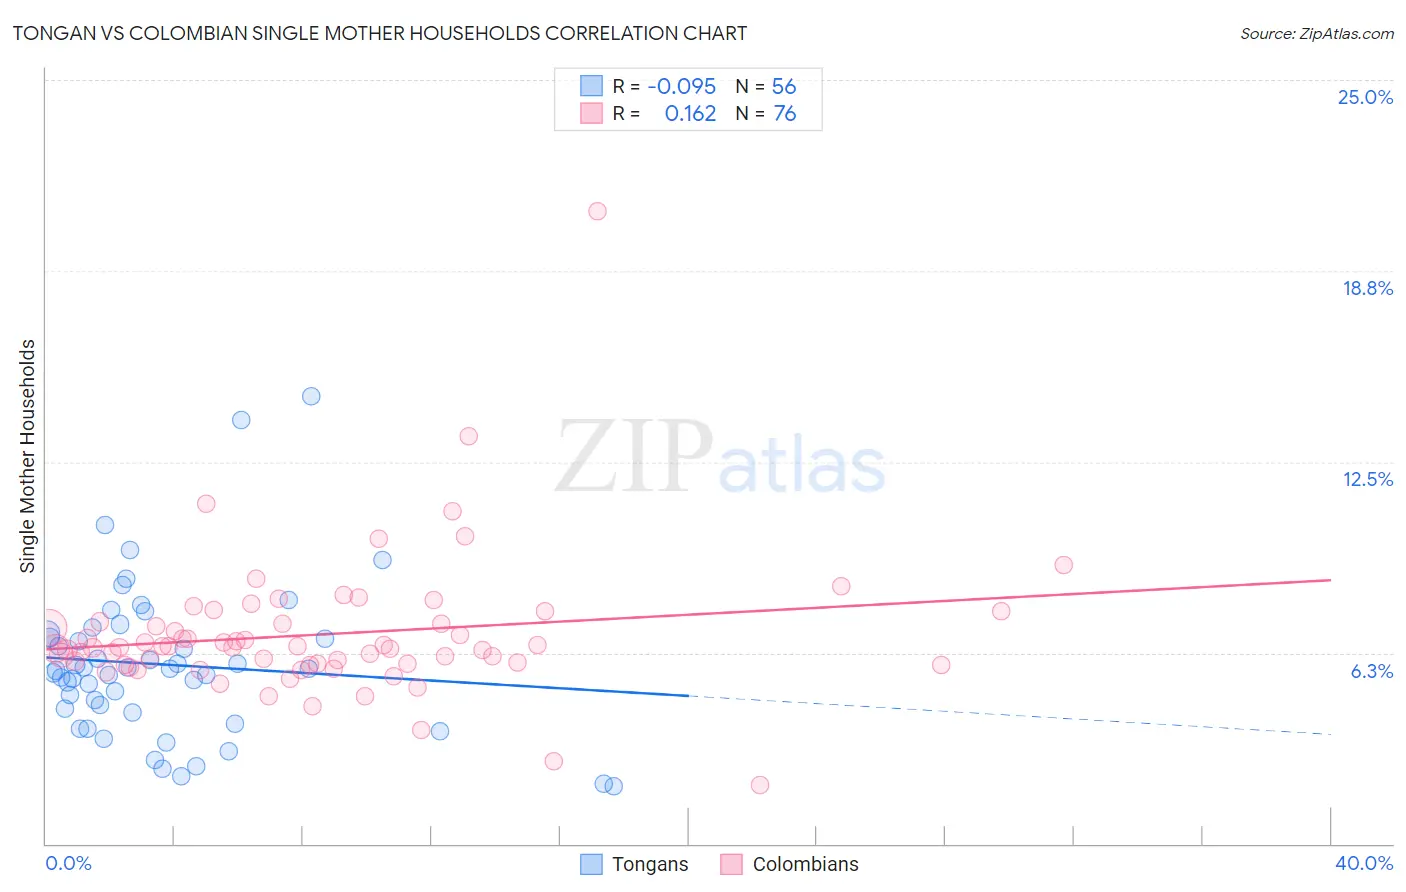
Tongan vs Colombian Single Mother Households Correlation Chart
The statistical analysis conducted on geographies consisting of 102,827,283 people shows a slight negative correlation between the proportion of Tongans and percentage of single mother households in the United States with a correlation coefficient (R) of -0.095 and weighted average of 5.8%. Similarly, the statistical analysis conducted on geographies consisting of 418,427,285 people shows a poor positive correlation between the proportion of Colombians and percentage of single mother households in the United States with a correlation coefficient (R) of 0.162 and weighted average of 6.6%, a difference of 12.4%.
Single Mother Households Correlation Summary
| Measurement | Tongan | Colombian |
| Minimum | 1.9% | 1.9% |
| Maximum | 14.7% | 20.7% |
| Range | 12.8% | 18.8% |
| Mean | 5.9% | 6.9% |
| Median | 5.7% | 6.4% |
| Interquartile 25% (IQ1) | 4.4% | 5.9% |
| Interquartile 75% (IQ3) | 6.8% | 7.2% |
| Interquartile Range (IQR) | 2.5% | 1.4% |
| Standard Deviation (Sample) | 2.5% | 2.3% |
| Standard Deviation (Population) | 2.5% | 2.3% |
Similar Demographics by Single Mother Households
Demographics Similar to Tongans by Single Mother Households
In terms of single mother households, the demographic groups most similar to Tongans are Argentinean (5.8%, a difference of 0.020%), Belgian (5.8%, a difference of 0.10%), Immigrants from Uzbekistan (5.9%, a difference of 0.17%), South African (5.8%, a difference of 0.19%), and Immigrants from Argentina (5.9%, a difference of 0.23%).
| Demographics | Rating | Rank | Single Mother Households |
| Mongolians | 95.3 /100 | #113 | Exceptional 5.8% |
| Dutch | 95.1 /100 | #114 | Exceptional 5.8% |
| Irish | 94.8 /100 | #115 | Exceptional 5.8% |
| Pennsylvania Germans | 94.7 /100 | #116 | Exceptional 5.8% |
| Bolivians | 94.6 /100 | #117 | Exceptional 5.8% |
| Laotians | 94.3 /100 | #118 | Exceptional 5.8% |
| South Africans | 94.1 /100 | #119 | Exceptional 5.8% |
| Tongans | 93.7 /100 | #120 | Exceptional 5.8% |
| Argentineans | 93.7 /100 | #121 | Exceptional 5.8% |
| Belgians | 93.5 /100 | #122 | Exceptional 5.8% |
| Immigrants | Uzbekistan | 93.4 /100 | #123 | Exceptional 5.9% |
| Immigrants | Argentina | 93.2 /100 | #124 | Exceptional 5.9% |
| Slavs | 92.9 /100 | #125 | Exceptional 5.9% |
| Welsh | 92.8 /100 | #126 | Exceptional 5.9% |
| Lebanese | 92.4 /100 | #127 | Exceptional 5.9% |
Demographics Similar to Colombians by Single Mother Households
In terms of single mother households, the demographic groups most similar to Colombians are Immigrants from Uganda (6.6%, a difference of 0.010%), South American (6.6%, a difference of 0.050%), Uruguayan (6.6%, a difference of 0.050%), American (6.6%, a difference of 0.11%), and Moroccan (6.6%, a difference of 0.16%).
| Demographics | Rating | Rank | Single Mother Households |
| Costa Ricans | 24.8 /100 | #186 | Fair 6.5% |
| Immigrants | Afghanistan | 24.7 /100 | #187 | Fair 6.5% |
| Ottawa | 23.8 /100 | #188 | Fair 6.5% |
| Delaware | 23.3 /100 | #189 | Fair 6.5% |
| Peruvians | 21.6 /100 | #190 | Fair 6.5% |
| Samoans | 21.2 /100 | #191 | Fair 6.5% |
| Americans | 19.0 /100 | #192 | Poor 6.6% |
| Colombians | 18.3 /100 | #193 | Poor 6.6% |
| Immigrants | Uganda | 18.3 /100 | #194 | Poor 6.6% |
| South Americans | 18.0 /100 | #195 | Poor 6.6% |
| Uruguayans | 18.0 /100 | #196 | Poor 6.6% |
| Moroccans | 17.4 /100 | #197 | Poor 6.6% |
| Hawaiians | 16.1 /100 | #198 | Poor 6.6% |
| Potawatomi | 15.5 /100 | #199 | Poor 6.6% |
| Immigrants | Ethiopia | 14.7 /100 | #200 | Poor 6.6% |