Tongan vs Immigrants from Senegal Single Mother Households
COMPARE
Tongan
Immigrants from Senegal
Single Mother Households
Single Mother Households Comparison
Tongans
Immigrants from Senegal
5.8%
SINGLE MOTHER HOUSEHOLDS
93.7/ 100
METRIC RATING
120th/ 347
METRIC RANK
8.3%
SINGLE MOTHER HOUSEHOLDS
0.0/ 100
METRIC RATING
321st/ 347
METRIC RANK
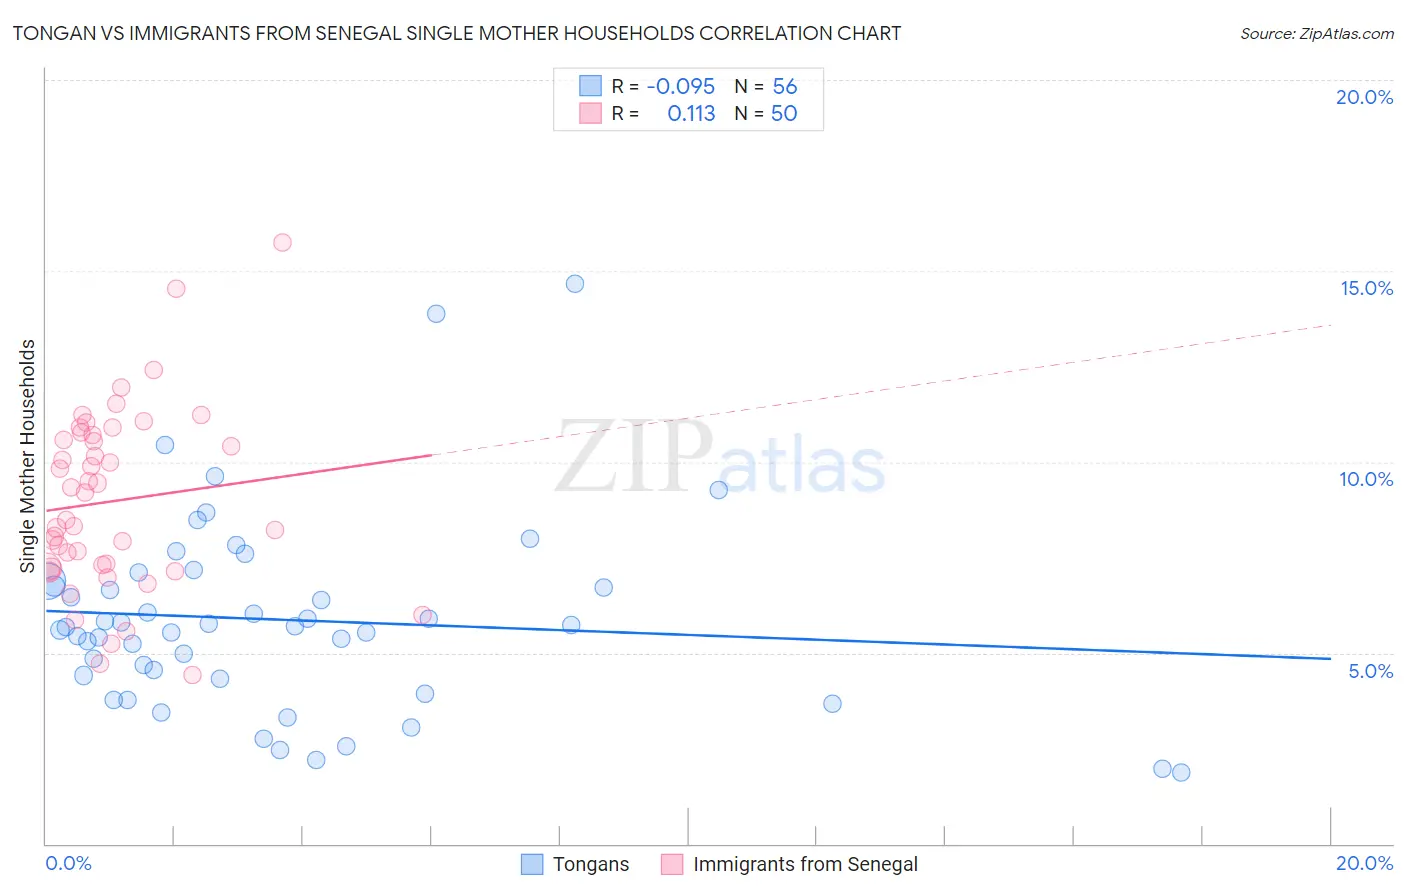
Tongan vs Immigrants from Senegal Single Mother Households Correlation Chart
The statistical analysis conducted on geographies consisting of 102,827,283 people shows a slight negative correlation between the proportion of Tongans and percentage of single mother households in the United States with a correlation coefficient (R) of -0.095 and weighted average of 5.8%. Similarly, the statistical analysis conducted on geographies consisting of 90,052,902 people shows a poor positive correlation between the proportion of Immigrants from Senegal and percentage of single mother households in the United States with a correlation coefficient (R) of 0.113 and weighted average of 8.3%, a difference of 41.5%.
Single Mother Households Correlation Summary
| Measurement | Tongan | Immigrants from Senegal |
| Minimum | 1.9% | 4.4% |
| Maximum | 14.7% | 15.7% |
| Range | 12.8% | 11.3% |
| Mean | 5.9% | 9.0% |
| Median | 5.7% | 8.8% |
| Interquartile 25% (IQ1) | 4.4% | 7.2% |
| Interquartile 75% (IQ3) | 6.8% | 10.7% |
| Interquartile Range (IQR) | 2.5% | 3.5% |
| Standard Deviation (Sample) | 2.5% | 2.4% |
| Standard Deviation (Population) | 2.5% | 2.3% |
Similar Demographics by Single Mother Households
Demographics Similar to Tongans by Single Mother Households
In terms of single mother households, the demographic groups most similar to Tongans are Argentinean (5.8%, a difference of 0.020%), Belgian (5.8%, a difference of 0.10%), Immigrants from Uzbekistan (5.9%, a difference of 0.17%), South African (5.8%, a difference of 0.19%), and Immigrants from Argentina (5.9%, a difference of 0.23%).
| Demographics | Rating | Rank | Single Mother Households |
| Mongolians | 95.3 /100 | #113 | Exceptional 5.8% |
| Dutch | 95.1 /100 | #114 | Exceptional 5.8% |
| Irish | 94.8 /100 | #115 | Exceptional 5.8% |
| Pennsylvania Germans | 94.7 /100 | #116 | Exceptional 5.8% |
| Bolivians | 94.6 /100 | #117 | Exceptional 5.8% |
| Laotians | 94.3 /100 | #118 | Exceptional 5.8% |
| South Africans | 94.1 /100 | #119 | Exceptional 5.8% |
| Tongans | 93.7 /100 | #120 | Exceptional 5.8% |
| Argentineans | 93.7 /100 | #121 | Exceptional 5.8% |
| Belgians | 93.5 /100 | #122 | Exceptional 5.8% |
| Immigrants | Uzbekistan | 93.4 /100 | #123 | Exceptional 5.9% |
| Immigrants | Argentina | 93.2 /100 | #124 | Exceptional 5.9% |
| Slavs | 92.9 /100 | #125 | Exceptional 5.9% |
| Welsh | 92.8 /100 | #126 | Exceptional 5.9% |
| Lebanese | 92.4 /100 | #127 | Exceptional 5.9% |
Demographics Similar to Immigrants from Senegal by Single Mother Households
In terms of single mother households, the demographic groups most similar to Immigrants from Senegal are Pima (8.3%, a difference of 0.080%), Bahamian (8.3%, a difference of 0.24%), Jamaican (8.2%, a difference of 0.36%), Senegalese (8.2%, a difference of 0.47%), and Haitian (8.3%, a difference of 0.61%).
| Demographics | Rating | Rank | Single Mother Households |
| Immigrants | Mexico | 0.0 /100 | #314 | Tragic 8.2% |
| Immigrants | Western Africa | 0.0 /100 | #315 | Tragic 8.2% |
| Africans | 0.0 /100 | #316 | Tragic 8.2% |
| Immigrants | Honduras | 0.0 /100 | #317 | Tragic 8.2% |
| Senegalese | 0.0 /100 | #318 | Tragic 8.2% |
| Jamaicans | 0.0 /100 | #319 | Tragic 8.2% |
| Bahamians | 0.0 /100 | #320 | Tragic 8.3% |
| Immigrants | Senegal | 0.0 /100 | #321 | Tragic 8.3% |
| Pima | 0.0 /100 | #322 | Tragic 8.3% |
| Haitians | 0.0 /100 | #323 | Tragic 8.3% |
| Immigrants | Jamaica | 0.0 /100 | #324 | Tragic 8.4% |
| Immigrants | Caribbean | 0.0 /100 | #325 | Tragic 8.4% |
| British West Indians | 0.0 /100 | #326 | Tragic 8.4% |
| Immigrants | Haiti | 0.0 /100 | #327 | Tragic 8.4% |
| Yakama | 0.0 /100 | #328 | Tragic 8.4% |