Tongan vs Navajo Single Mother Households
COMPARE
Tongan
Navajo
Single Mother Households
Single Mother Households Comparison
Tongans
Navajo
5.8%
SINGLE MOTHER HOUSEHOLDS
93.7/ 100
METRIC RATING
120th/ 347
METRIC RANK
8.8%
SINGLE MOTHER HOUSEHOLDS
0.0/ 100
METRIC RATING
337th/ 347
METRIC RANK
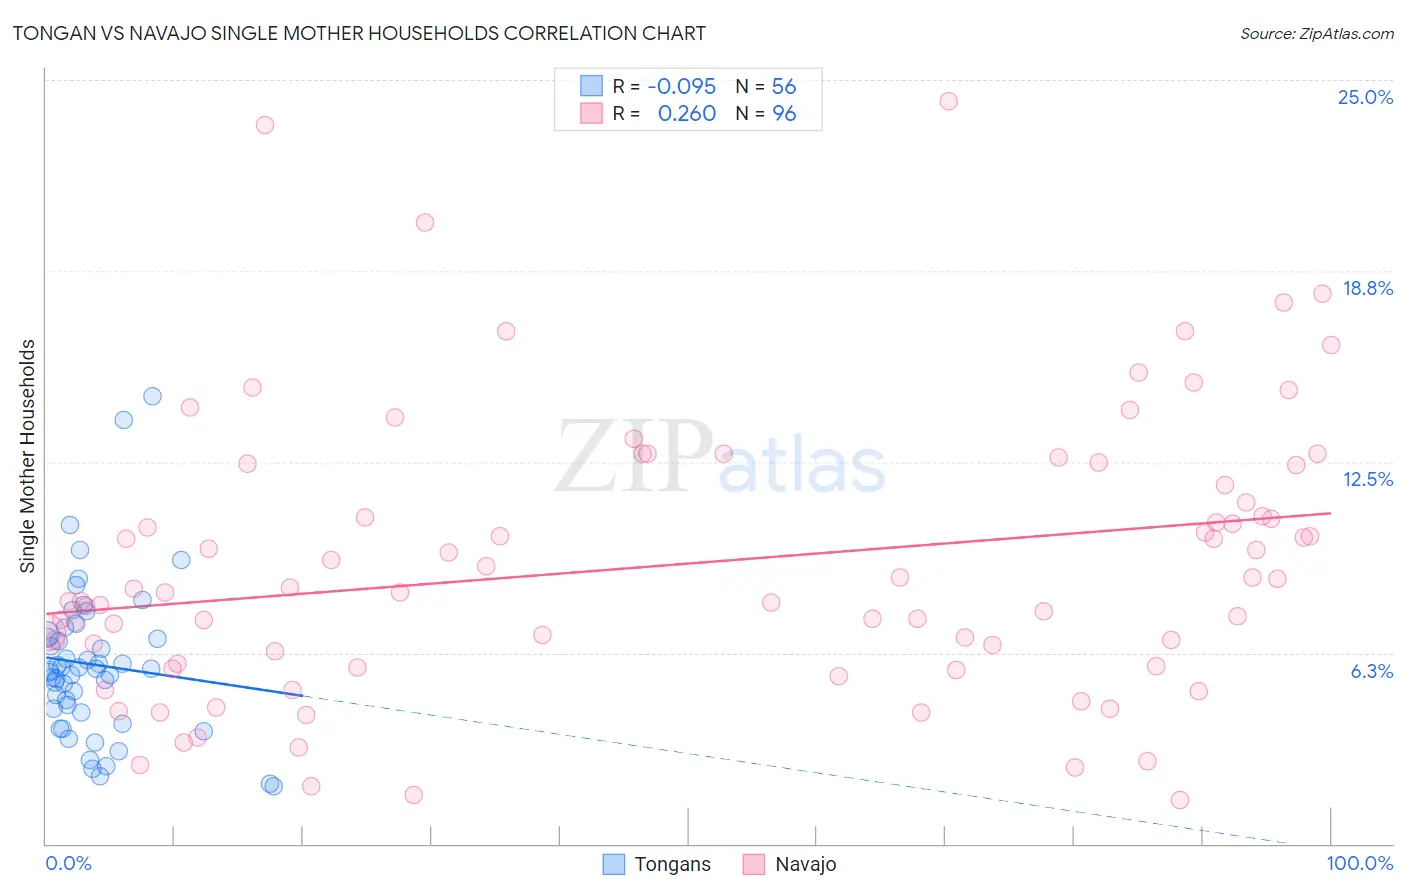
Tongan vs Navajo Single Mother Households Correlation Chart
The statistical analysis conducted on geographies consisting of 102,827,283 people shows a slight negative correlation between the proportion of Tongans and percentage of single mother households in the United States with a correlation coefficient (R) of -0.095 and weighted average of 5.8%. Similarly, the statistical analysis conducted on geographies consisting of 224,480,128 people shows a weak positive correlation between the proportion of Navajo and percentage of single mother households in the United States with a correlation coefficient (R) of 0.260 and weighted average of 8.8%, a difference of 51.3%.
Single Mother Households Correlation Summary
| Measurement | Tongan | Navajo |
| Minimum | 1.9% | 1.4% |
| Maximum | 14.7% | 24.3% |
| Range | 12.8% | 22.9% |
| Mean | 5.9% | 9.1% |
| Median | 5.7% | 8.3% |
| Interquartile 25% (IQ1) | 4.4% | 5.9% |
| Interquartile 75% (IQ3) | 6.8% | 12.1% |
| Interquartile Range (IQR) | 2.5% | 6.2% |
| Standard Deviation (Sample) | 2.5% | 4.6% |
| Standard Deviation (Population) | 2.5% | 4.6% |
Similar Demographics by Single Mother Households
Demographics Similar to Tongans by Single Mother Households
In terms of single mother households, the demographic groups most similar to Tongans are Argentinean (5.8%, a difference of 0.020%), Belgian (5.8%, a difference of 0.10%), Immigrants from Uzbekistan (5.9%, a difference of 0.17%), South African (5.8%, a difference of 0.19%), and Immigrants from Argentina (5.9%, a difference of 0.23%).
| Demographics | Rating | Rank | Single Mother Households |
| Mongolians | 95.3 /100 | #113 | Exceptional 5.8% |
| Dutch | 95.1 /100 | #114 | Exceptional 5.8% |
| Irish | 94.8 /100 | #115 | Exceptional 5.8% |
| Pennsylvania Germans | 94.7 /100 | #116 | Exceptional 5.8% |
| Bolivians | 94.6 /100 | #117 | Exceptional 5.8% |
| Laotians | 94.3 /100 | #118 | Exceptional 5.8% |
| South Africans | 94.1 /100 | #119 | Exceptional 5.8% |
| Tongans | 93.7 /100 | #120 | Exceptional 5.8% |
| Argentineans | 93.7 /100 | #121 | Exceptional 5.8% |
| Belgians | 93.5 /100 | #122 | Exceptional 5.8% |
| Immigrants | Uzbekistan | 93.4 /100 | #123 | Exceptional 5.9% |
| Immigrants | Argentina | 93.2 /100 | #124 | Exceptional 5.9% |
| Slavs | 92.9 /100 | #125 | Exceptional 5.9% |
| Welsh | 92.8 /100 | #126 | Exceptional 5.9% |
| Lebanese | 92.4 /100 | #127 | Exceptional 5.9% |
Demographics Similar to Navajo by Single Mother Households
In terms of single mother households, the demographic groups most similar to Navajo are Cape Verdean (8.9%, a difference of 0.10%), Puerto Rican (8.7%, a difference of 1.2%), Immigrants from Dominica (8.7%, a difference of 1.2%), Immigrants from Liberia (8.7%, a difference of 1.5%), and Black/African American (9.0%, a difference of 1.7%).
| Demographics | Rating | Rank | Single Mother Households |
| Inupiat | 0.0 /100 | #330 | Tragic 8.5% |
| Sioux | 0.0 /100 | #331 | Tragic 8.5% |
| U.S. Virgin Islanders | 0.0 /100 | #332 | Tragic 8.6% |
| Liberians | 0.0 /100 | #333 | Tragic 8.6% |
| Immigrants | Liberia | 0.0 /100 | #334 | Tragic 8.7% |
| Immigrants | Dominica | 0.0 /100 | #335 | Tragic 8.7% |
| Puerto Ricans | 0.0 /100 | #336 | Tragic 8.7% |
| Navajo | 0.0 /100 | #337 | Tragic 8.8% |
| Cape Verdeans | 0.0 /100 | #338 | Tragic 8.9% |
| Blacks/African Americans | 0.0 /100 | #339 | Tragic 9.0% |
| Lumbee | 0.0 /100 | #340 | Tragic 9.1% |
| Tohono O'odham | 0.0 /100 | #341 | Tragic 9.1% |
| Menominee | 0.0 /100 | #342 | Tragic 9.2% |
| Dominicans | 0.0 /100 | #343 | Tragic 9.2% |
| Immigrants | Dominican Republic | 0.0 /100 | #344 | Tragic 9.5% |