Tongan vs Austrian Single Mother Households
COMPARE
Tongan
Austrian
Single Mother Households
Single Mother Households Comparison
Tongans
Austrians
5.8%
SINGLE MOTHER HOUSEHOLDS
93.7/ 100
METRIC RATING
120th/ 347
METRIC RANK
5.7%
SINGLE MOTHER HOUSEHOLDS
96.4/ 100
METRIC RATING
96th/ 347
METRIC RANK
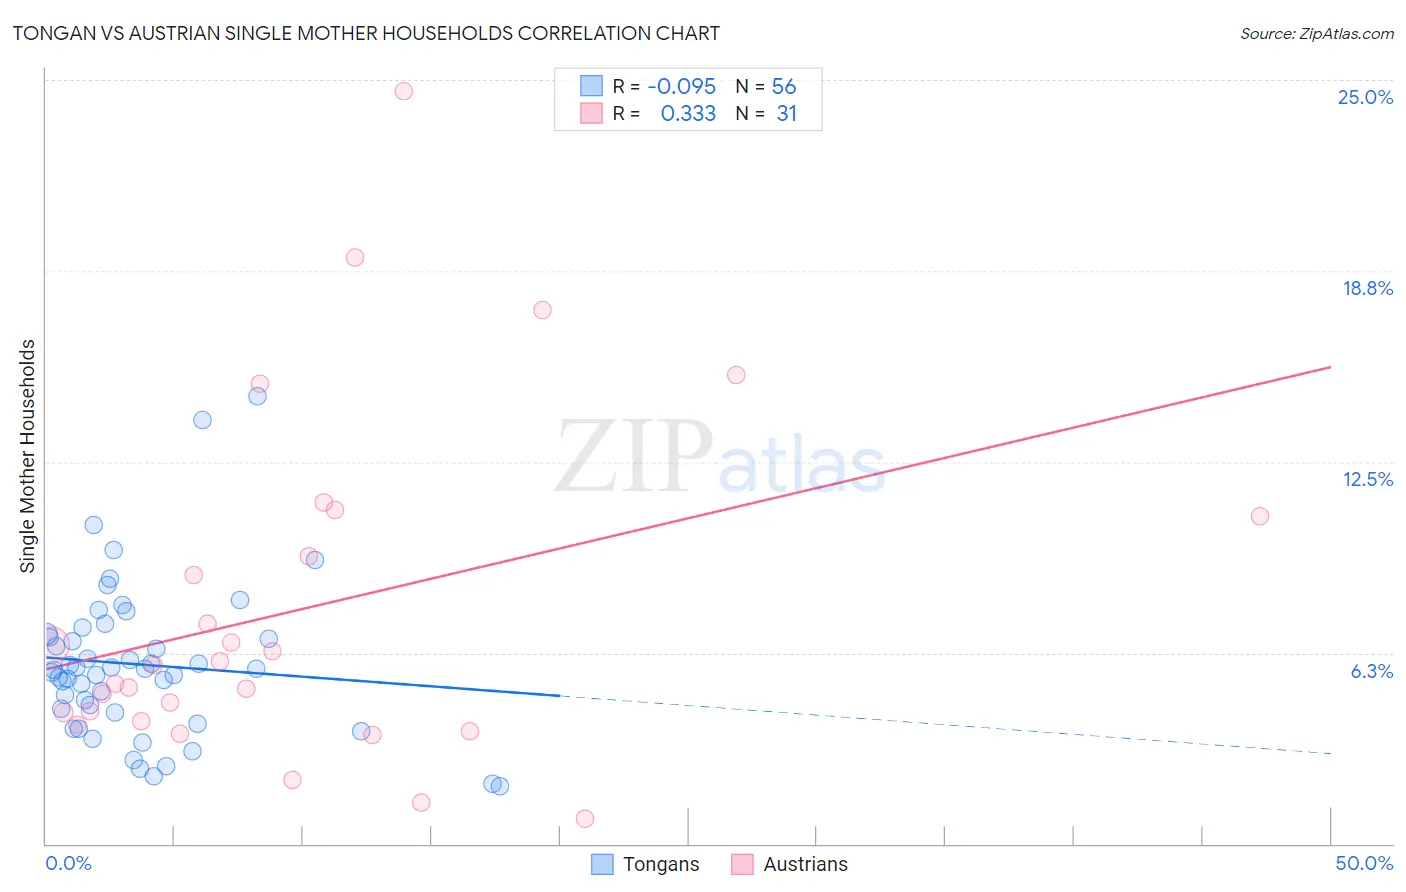
Tongan vs Austrian Single Mother Households Correlation Chart
The statistical analysis conducted on geographies consisting of 102,827,283 people shows a slight negative correlation between the proportion of Tongans and percentage of single mother households in the United States with a correlation coefficient (R) of -0.095 and weighted average of 5.8%. Similarly, the statistical analysis conducted on geographies consisting of 449,998,235 people shows a mild positive correlation between the proportion of Austrians and percentage of single mother households in the United States with a correlation coefficient (R) of 0.333 and weighted average of 5.7%, a difference of 1.8%.
Single Mother Households Correlation Summary
| Measurement | Tongan | Austrian |
| Minimum | 1.9% | 0.83% |
| Maximum | 14.7% | 24.6% |
| Range | 12.8% | 23.8% |
| Mean | 5.9% | 7.7% |
| Median | 5.7% | 5.8% |
| Interquartile 25% (IQ1) | 4.4% | 4.0% |
| Interquartile 75% (IQ3) | 6.8% | 10.7% |
| Interquartile Range (IQR) | 2.5% | 6.7% |
| Standard Deviation (Sample) | 2.5% | 5.6% |
| Standard Deviation (Population) | 2.5% | 5.5% |
Similar Demographics by Single Mother Households
Demographics Similar to Tongans by Single Mother Households
In terms of single mother households, the demographic groups most similar to Tongans are Argentinean (5.8%, a difference of 0.020%), Belgian (5.8%, a difference of 0.10%), Immigrants from Uzbekistan (5.9%, a difference of 0.17%), South African (5.8%, a difference of 0.19%), and Immigrants from Argentina (5.9%, a difference of 0.23%).
| Demographics | Rating | Rank | Single Mother Households |
| Mongolians | 95.3 /100 | #113 | Exceptional 5.8% |
| Dutch | 95.1 /100 | #114 | Exceptional 5.8% |
| Irish | 94.8 /100 | #115 | Exceptional 5.8% |
| Pennsylvania Germans | 94.7 /100 | #116 | Exceptional 5.8% |
| Bolivians | 94.6 /100 | #117 | Exceptional 5.8% |
| Laotians | 94.3 /100 | #118 | Exceptional 5.8% |
| South Africans | 94.1 /100 | #119 | Exceptional 5.8% |
| Tongans | 93.7 /100 | #120 | Exceptional 5.8% |
| Argentineans | 93.7 /100 | #121 | Exceptional 5.8% |
| Belgians | 93.5 /100 | #122 | Exceptional 5.8% |
| Immigrants | Uzbekistan | 93.4 /100 | #123 | Exceptional 5.9% |
| Immigrants | Argentina | 93.2 /100 | #124 | Exceptional 5.9% |
| Slavs | 92.9 /100 | #125 | Exceptional 5.9% |
| Welsh | 92.8 /100 | #126 | Exceptional 5.9% |
| Lebanese | 92.4 /100 | #127 | Exceptional 5.9% |
Demographics Similar to Austrians by Single Mother Households
In terms of single mother households, the demographic groups most similar to Austrians are Tlingit-Haida (5.7%, a difference of 0.050%), Immigrants from South Africa (5.7%, a difference of 0.090%), Slovak (5.7%, a difference of 0.15%), Immigrants from Poland (5.8%, a difference of 0.15%), and Scandinavian (5.8%, a difference of 0.16%).
| Demographics | Rating | Rank | Single Mother Households |
| Ukrainians | 97.2 /100 | #89 | Exceptional 5.7% |
| Immigrants | Indonesia | 97.2 /100 | #90 | Exceptional 5.7% |
| Europeans | 97.0 /100 | #91 | Exceptional 5.7% |
| Immigrants | Western Asia | 96.7 /100 | #92 | Exceptional 5.7% |
| Serbians | 96.7 /100 | #93 | Exceptional 5.7% |
| Basques | 96.7 /100 | #94 | Exceptional 5.7% |
| Slovaks | 96.6 /100 | #95 | Exceptional 5.7% |
| Austrians | 96.4 /100 | #96 | Exceptional 5.7% |
| Tlingit-Haida | 96.4 /100 | #97 | Exceptional 5.7% |
| Immigrants | South Africa | 96.3 /100 | #98 | Exceptional 5.7% |
| Immigrants | Poland | 96.3 /100 | #99 | Exceptional 5.8% |
| Scandinavians | 96.2 /100 | #100 | Exceptional 5.8% |
| Germans | 96.2 /100 | #101 | Exceptional 5.8% |
| English | 96.2 /100 | #102 | Exceptional 5.8% |
| Scottish | 96.2 /100 | #103 | Exceptional 5.8% |