Immigrants from Croatia vs Latvian Divorced or Separated
COMPARE
Immigrants from Croatia
Latvian
Divorced or Separated
Divorced or Separated Comparison
Immigrants from Croatia
Latvians
11.6%
DIVORCED OR SEPARATED
98.3/ 100
METRIC RATING
102nd/ 347
METRIC RANK
11.6%
DIVORCED OR SEPARATED
98.7/ 100
METRIC RATING
97th/ 347
METRIC RANK
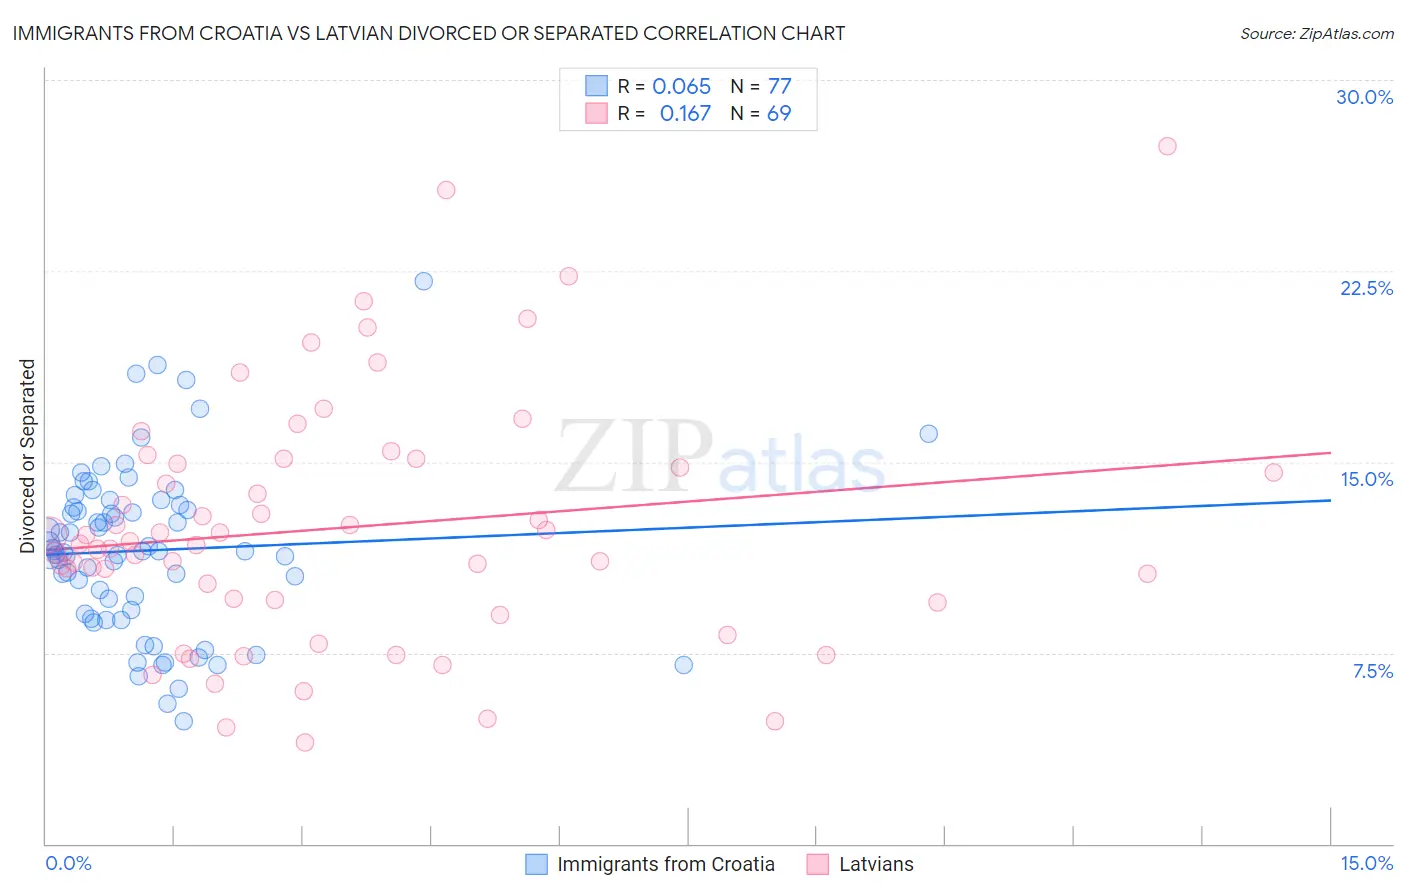
Immigrants from Croatia vs Latvian Divorced or Separated Correlation Chart
The statistical analysis conducted on geographies consisting of 132,566,764 people shows a slight positive correlation between the proportion of Immigrants from Croatia and percentage of population currently divorced or separated in the United States with a correlation coefficient (R) of 0.065 and weighted average of 11.6%. Similarly, the statistical analysis conducted on geographies consisting of 220,642,308 people shows a poor positive correlation between the proportion of Latvians and percentage of population currently divorced or separated in the United States with a correlation coefficient (R) of 0.167 and weighted average of 11.6%, a difference of 0.26%.
Divorced or Separated Correlation Summary
| Measurement | Immigrants from Croatia | Latvian |
| Minimum | 4.8% | 4.0% |
| Maximum | 22.1% | 27.4% |
| Range | 17.3% | 23.4% |
| Mean | 11.5% | 12.4% |
| Median | 11.5% | 11.8% |
| Interquartile 25% (IQ1) | 9.1% | 9.5% |
| Interquartile 75% (IQ3) | 13.3% | 15.0% |
| Interquartile Range (IQR) | 4.1% | 5.5% |
| Standard Deviation (Sample) | 3.3% | 4.8% |
| Standard Deviation (Population) | 3.2% | 4.8% |
Demographics Similar to Immigrants from Croatia and Latvians by Divorced or Separated
In terms of divorced or separated, the demographic groups most similar to Immigrants from Croatia are Maltese (11.6%, a difference of 0.040%), Salvadoran (11.6%, a difference of 0.050%), Immigrants from Guyana (11.6%, a difference of 0.14%), Immigrants from Northern Europe (11.6%, a difference of 0.17%), and Immigrants from El Salvador (11.7%, a difference of 0.18%). Similarly, the demographic groups most similar to Latvians are Immigrants from Ukraine (11.6%, a difference of 0.030%), Immigrants from Jordan (11.6%, a difference of 0.040%), Immigrants from Serbia (11.6%, a difference of 0.050%), Immigrants from Sweden (11.6%, a difference of 0.060%), and Immigrants from Northern Europe (11.6%, a difference of 0.090%).
| Demographics | Rating | Rank | Divorced or Separated |
| Immigrants | Southern Europe | 99.1 /100 | #89 | Exceptional 11.6% |
| Zimbabweans | 99.0 /100 | #90 | Exceptional 11.6% |
| Spanish American Indians | 99.0 /100 | #91 | Exceptional 11.6% |
| Immigrants | Denmark | 98.9 /100 | #92 | Exceptional 11.6% |
| Arabs | 98.9 /100 | #93 | Exceptional 11.6% |
| Immigrants | Fiji | 98.9 /100 | #94 | Exceptional 11.6% |
| Immigrants | Serbia | 98.8 /100 | #95 | Exceptional 11.6% |
| Immigrants | Ukraine | 98.7 /100 | #96 | Exceptional 11.6% |
| Latvians | 98.7 /100 | #97 | Exceptional 11.6% |
| Immigrants | Jordan | 98.6 /100 | #98 | Exceptional 11.6% |
| Immigrants | Sweden | 98.6 /100 | #99 | Exceptional 11.6% |
| Immigrants | Northern Europe | 98.6 /100 | #100 | Exceptional 11.6% |
| Immigrants | Guyana | 98.5 /100 | #101 | Exceptional 11.6% |
| Immigrants | Croatia | 98.3 /100 | #102 | Exceptional 11.6% |
| Maltese | 98.2 /100 | #103 | Exceptional 11.6% |
| Salvadorans | 98.2 /100 | #104 | Exceptional 11.6% |
| Immigrants | El Salvador | 97.9 /100 | #105 | Exceptional 11.7% |
| Immigrants | Kazakhstan | 97.8 /100 | #106 | Exceptional 11.7% |
| Native Hawaiians | 97.2 /100 | #107 | Exceptional 11.7% |
| Greeks | 96.9 /100 | #108 | Exceptional 11.7% |
| Immigrants | South Africa | 96.9 /100 | #109 | Exceptional 11.7% |