Tlingit-Haida vs Immigrants from Canada Divorced or Separated
COMPARE
Tlingit-Haida
Immigrants from Canada
Divorced or Separated
Divorced or Separated Comparison
Tlingit-Haida
Immigrants from Canada
13.2%
DIVORCED OR SEPARATED
0.0/ 100
METRIC RATING
306th/ 347
METRIC RANK
12.1%
DIVORCED OR SEPARATED
44.0/ 100
METRIC RATING
181st/ 347
METRIC RANK
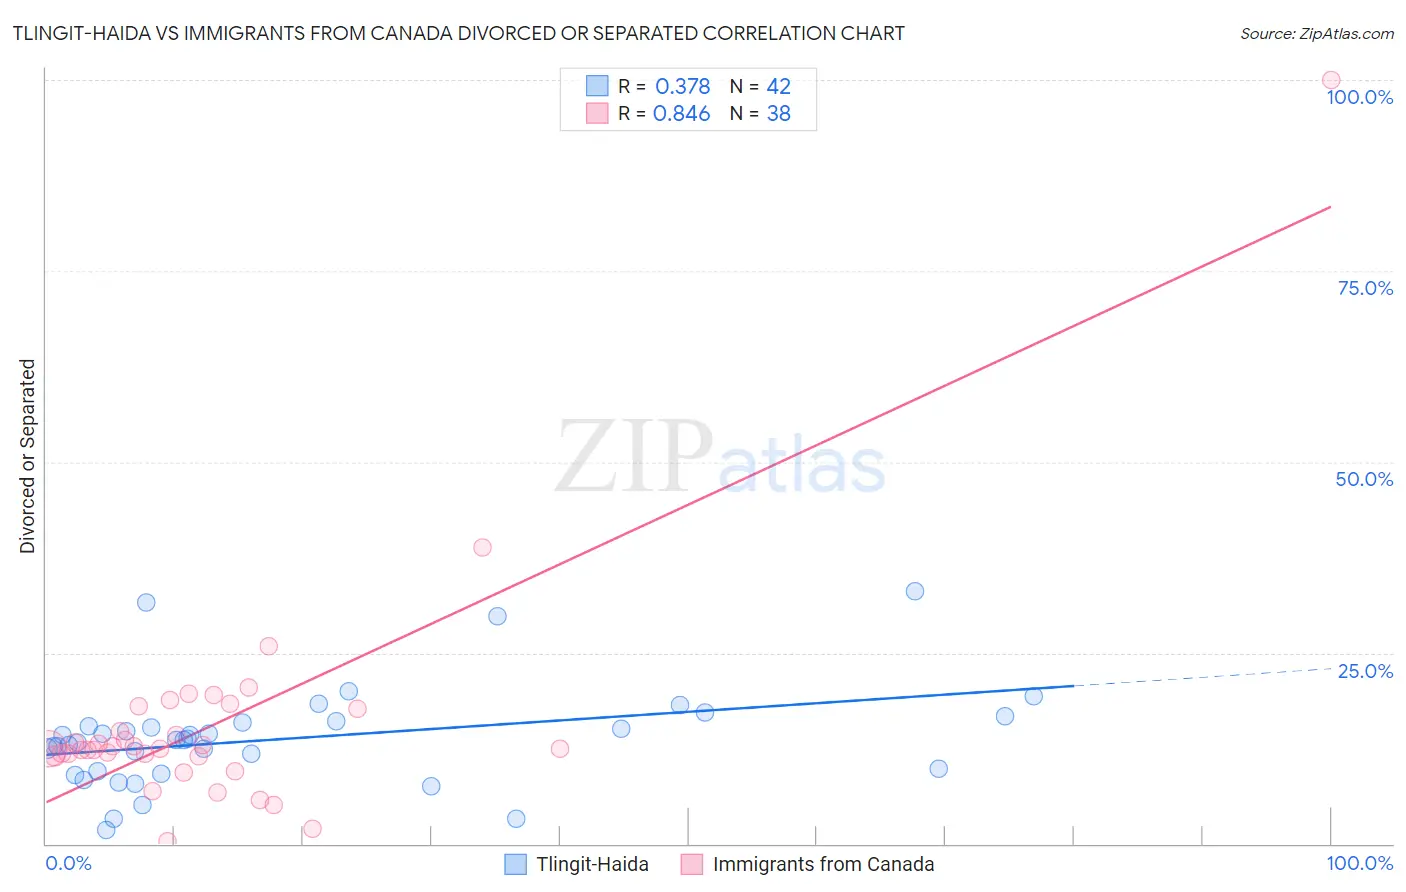
Tlingit-Haida vs Immigrants from Canada Divorced or Separated Correlation Chart
The statistical analysis conducted on geographies consisting of 60,872,098 people shows a mild positive correlation between the proportion of Tlingit-Haida and percentage of population currently divorced or separated in the United States with a correlation coefficient (R) of 0.378 and weighted average of 13.2%. Similarly, the statistical analysis conducted on geographies consisting of 459,212,003 people shows a very strong positive correlation between the proportion of Immigrants from Canada and percentage of population currently divorced or separated in the United States with a correlation coefficient (R) of 0.846 and weighted average of 12.1%, a difference of 9.1%.
Divorced or Separated Correlation Summary
| Measurement | Tlingit-Haida | Immigrants from Canada |
| Minimum | 1.8% | 0.33% |
| Maximum | 33.1% | 100.0% |
| Range | 31.3% | 99.7% |
| Mean | 13.8% | 15.6% |
| Median | 13.6% | 12.5% |
| Interquartile 25% (IQ1) | 9.4% | 11.5% |
| Interquartile 75% (IQ3) | 15.9% | 17.6% |
| Interquartile Range (IQR) | 6.5% | 6.1% |
| Standard Deviation (Sample) | 6.6% | 15.5% |
| Standard Deviation (Population) | 6.5% | 15.3% |
Similar Demographics by Divorced or Separated
Demographics Similar to Tlingit-Haida by Divorced or Separated
In terms of divorced or separated, the demographic groups most similar to Tlingit-Haida are Chippewa (13.2%, a difference of 0.16%), Hopi (13.2%, a difference of 0.22%), French American Indian (13.2%, a difference of 0.25%), Ottawa (13.2%, a difference of 0.34%), and Cape Verdean (13.1%, a difference of 0.35%).
| Demographics | Rating | Rank | Divorced or Separated |
| Immigrants | Jamaica | 0.0 /100 | #299 | Tragic 13.0% |
| Immigrants | Cabo Verde | 0.0 /100 | #300 | Tragic 13.1% |
| Alaskan Athabascans | 0.0 /100 | #301 | Tragic 13.1% |
| Immigrants | Venezuela | 0.0 /100 | #302 | Tragic 13.1% |
| Cape Verdeans | 0.0 /100 | #303 | Tragic 13.1% |
| Hopi | 0.0 /100 | #304 | Tragic 13.2% |
| Chippewa | 0.0 /100 | #305 | Tragic 13.2% |
| Tlingit-Haida | 0.0 /100 | #306 | Tragic 13.2% |
| French American Indians | 0.0 /100 | #307 | Tragic 13.2% |
| Ottawa | 0.0 /100 | #308 | Tragic 13.2% |
| Americans | 0.0 /100 | #309 | Tragic 13.2% |
| Africans | 0.0 /100 | #310 | Tragic 13.2% |
| Sioux | 0.0 /100 | #311 | Tragic 13.2% |
| Blackfeet | 0.0 /100 | #312 | Tragic 13.3% |
| Immigrants | Nicaragua | 0.0 /100 | #313 | Tragic 13.3% |
Demographics Similar to Immigrants from Canada by Divorced or Separated
In terms of divorced or separated, the demographic groups most similar to Immigrants from Canada are Barbadian (12.1%, a difference of 0.030%), Immigrants from Ethiopia (12.1%, a difference of 0.030%), Immigrants from Central America (12.1%, a difference of 0.040%), Immigrants from Western Europe (12.1%, a difference of 0.050%), and Ghanaian (12.1%, a difference of 0.060%).
| Demographics | Rating | Rank | Divorced or Separated |
| Hawaiians | 50.0 /100 | #174 | Average 12.1% |
| Immigrants | Sierra Leone | 50.0 /100 | #175 | Average 12.1% |
| Pennsylvania Germans | 48.9 /100 | #176 | Average 12.1% |
| Brazilians | 47.7 /100 | #177 | Average 12.1% |
| Ghanaians | 45.9 /100 | #178 | Average 12.1% |
| Immigrants | Western Europe | 45.6 /100 | #179 | Average 12.1% |
| Barbadians | 45.0 /100 | #180 | Average 12.1% |
| Immigrants | Canada | 44.0 /100 | #181 | Average 12.1% |
| Immigrants | Ethiopia | 43.1 /100 | #182 | Average 12.1% |
| Immigrants | Central America | 42.9 /100 | #183 | Average 12.1% |
| Immigrants | North America | 41.1 /100 | #184 | Average 12.1% |
| Immigrants | Nigeria | 40.5 /100 | #185 | Average 12.1% |
| Immigrants | Chile | 39.0 /100 | #186 | Fair 12.1% |
| Belizeans | 37.7 /100 | #187 | Fair 12.1% |
| Immigrants | Belize | 37.6 /100 | #188 | Fair 12.1% |