Iroquois vs Latvian Divorced or Separated
COMPARE
Iroquois
Latvian
Divorced or Separated
Divorced or Separated Comparison
Iroquois
Latvians
12.9%
DIVORCED OR SEPARATED
0.0/ 100
METRIC RATING
289th/ 347
METRIC RANK
11.6%
DIVORCED OR SEPARATED
98.7/ 100
METRIC RATING
97th/ 347
METRIC RANK
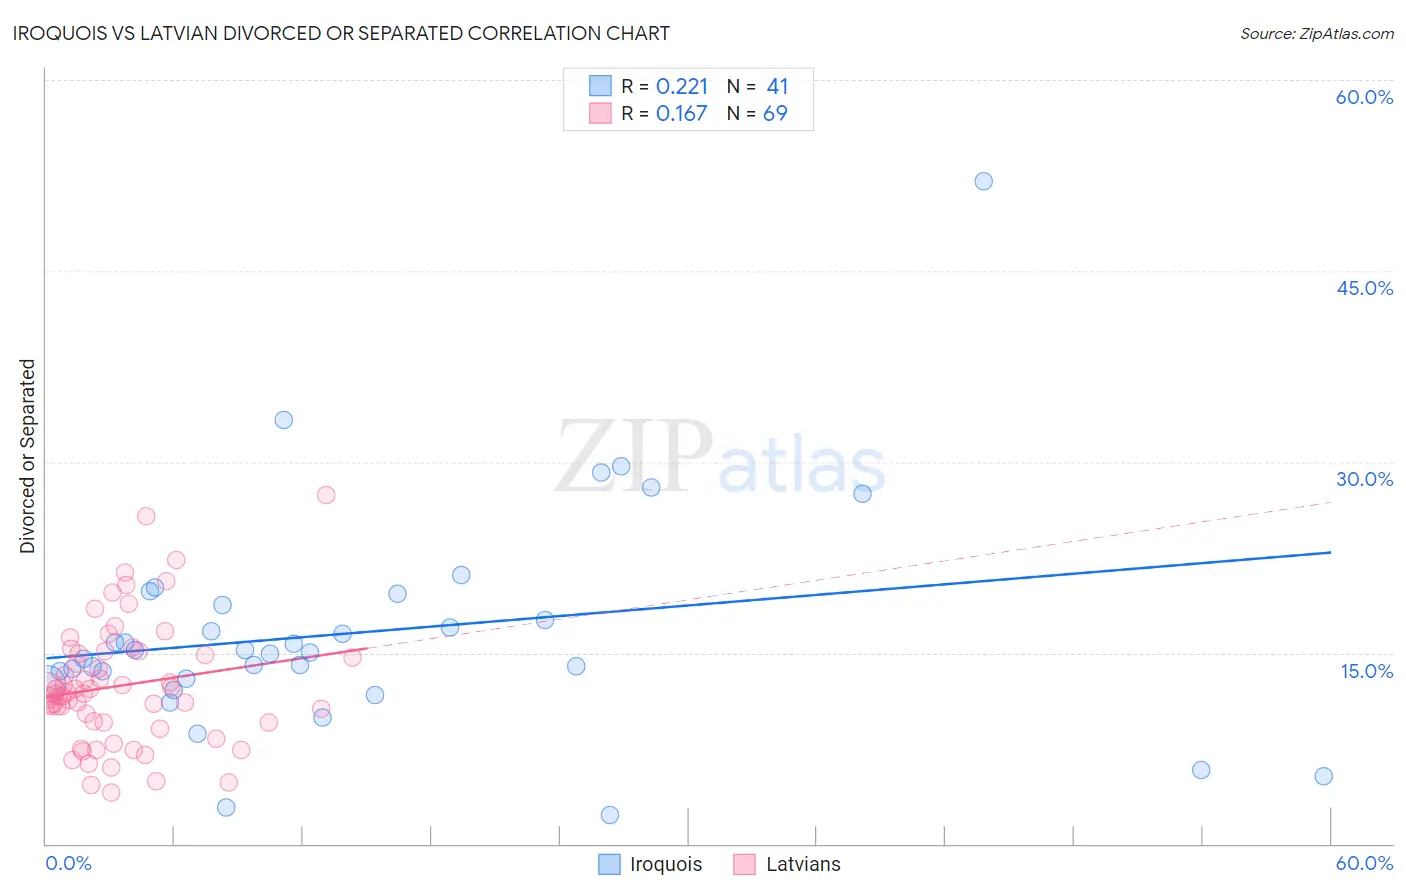
Iroquois vs Latvian Divorced or Separated Correlation Chart
The statistical analysis conducted on geographies consisting of 207,262,032 people shows a weak positive correlation between the proportion of Iroquois and percentage of population currently divorced or separated in the United States with a correlation coefficient (R) of 0.221 and weighted average of 12.9%. Similarly, the statistical analysis conducted on geographies consisting of 220,642,308 people shows a poor positive correlation between the proportion of Latvians and percentage of population currently divorced or separated in the United States with a correlation coefficient (R) of 0.167 and weighted average of 11.6%, a difference of 10.8%.
Divorced or Separated Correlation Summary
| Measurement | Iroquois | Latvian |
| Minimum | 2.3% | 4.0% |
| Maximum | 52.0% | 27.4% |
| Range | 49.7% | 23.4% |
| Mean | 16.6% | 12.4% |
| Median | 15.0% | 11.8% |
| Interquartile 25% (IQ1) | 12.8% | 9.5% |
| Interquartile 75% (IQ3) | 19.2% | 15.0% |
| Interquartile Range (IQR) | 6.4% | 5.5% |
| Standard Deviation (Sample) | 8.8% | 4.8% |
| Standard Deviation (Population) | 8.7% | 4.8% |
Similar Demographics by Divorced or Separated
Demographics Similar to Iroquois by Divorced or Separated
In terms of divorced or separated, the demographic groups most similar to Iroquois are Pima (12.9%, a difference of 0.14%), French Canadian (12.8%, a difference of 0.15%), Immigrants from Honduras (12.9%, a difference of 0.26%), Scotch-Irish (12.9%, a difference of 0.32%), and Honduran (12.8%, a difference of 0.41%).
| Demographics | Rating | Rank | Divorced or Separated |
| Sub-Saharan Africans | 0.1 /100 | #282 | Tragic 12.7% |
| Delaware | 0.1 /100 | #283 | Tragic 12.7% |
| Immigrants | Nonimmigrants | 0.1 /100 | #284 | Tragic 12.8% |
| French | 0.1 /100 | #285 | Tragic 12.8% |
| Spanish | 0.1 /100 | #286 | Tragic 12.8% |
| Hondurans | 0.1 /100 | #287 | Tragic 12.8% |
| French Canadians | 0.1 /100 | #288 | Tragic 12.8% |
| Iroquois | 0.0 /100 | #289 | Tragic 12.9% |
| Pima | 0.0 /100 | #290 | Tragic 12.9% |
| Immigrants | Honduras | 0.0 /100 | #291 | Tragic 12.9% |
| Scotch-Irish | 0.0 /100 | #292 | Tragic 12.9% |
| Jamaicans | 0.0 /100 | #293 | Tragic 12.9% |
| Apache | 0.0 /100 | #294 | Tragic 12.9% |
| Celtics | 0.0 /100 | #295 | Tragic 13.0% |
| Nicaraguans | 0.0 /100 | #296 | Tragic 13.0% |
Demographics Similar to Latvians by Divorced or Separated
In terms of divorced or separated, the demographic groups most similar to Latvians are Immigrants from Ukraine (11.6%, a difference of 0.030%), Immigrants from Jordan (11.6%, a difference of 0.040%), Immigrants from Serbia (11.6%, a difference of 0.050%), Immigrants from Sweden (11.6%, a difference of 0.060%), and Immigrants from Northern Europe (11.6%, a difference of 0.090%).
| Demographics | Rating | Rank | Divorced or Separated |
| Zimbabweans | 99.0 /100 | #90 | Exceptional 11.6% |
| Spanish American Indians | 99.0 /100 | #91 | Exceptional 11.6% |
| Immigrants | Denmark | 98.9 /100 | #92 | Exceptional 11.6% |
| Arabs | 98.9 /100 | #93 | Exceptional 11.6% |
| Immigrants | Fiji | 98.9 /100 | #94 | Exceptional 11.6% |
| Immigrants | Serbia | 98.8 /100 | #95 | Exceptional 11.6% |
| Immigrants | Ukraine | 98.7 /100 | #96 | Exceptional 11.6% |
| Latvians | 98.7 /100 | #97 | Exceptional 11.6% |
| Immigrants | Jordan | 98.6 /100 | #98 | Exceptional 11.6% |
| Immigrants | Sweden | 98.6 /100 | #99 | Exceptional 11.6% |
| Immigrants | Northern Europe | 98.6 /100 | #100 | Exceptional 11.6% |
| Immigrants | Guyana | 98.5 /100 | #101 | Exceptional 11.6% |
| Immigrants | Croatia | 98.3 /100 | #102 | Exceptional 11.6% |
| Maltese | 98.2 /100 | #103 | Exceptional 11.6% |
| Salvadorans | 98.2 /100 | #104 | Exceptional 11.6% |