Fijian vs Latvian Divorced or Separated
COMPARE
Fijian
Latvian
Divorced or Separated
Divorced or Separated Comparison
Fijians
Latvians
12.6%
DIVORCED OR SEPARATED
0.4/ 100
METRIC RATING
268th/ 347
METRIC RANK
11.6%
DIVORCED OR SEPARATED
98.7/ 100
METRIC RATING
97th/ 347
METRIC RANK
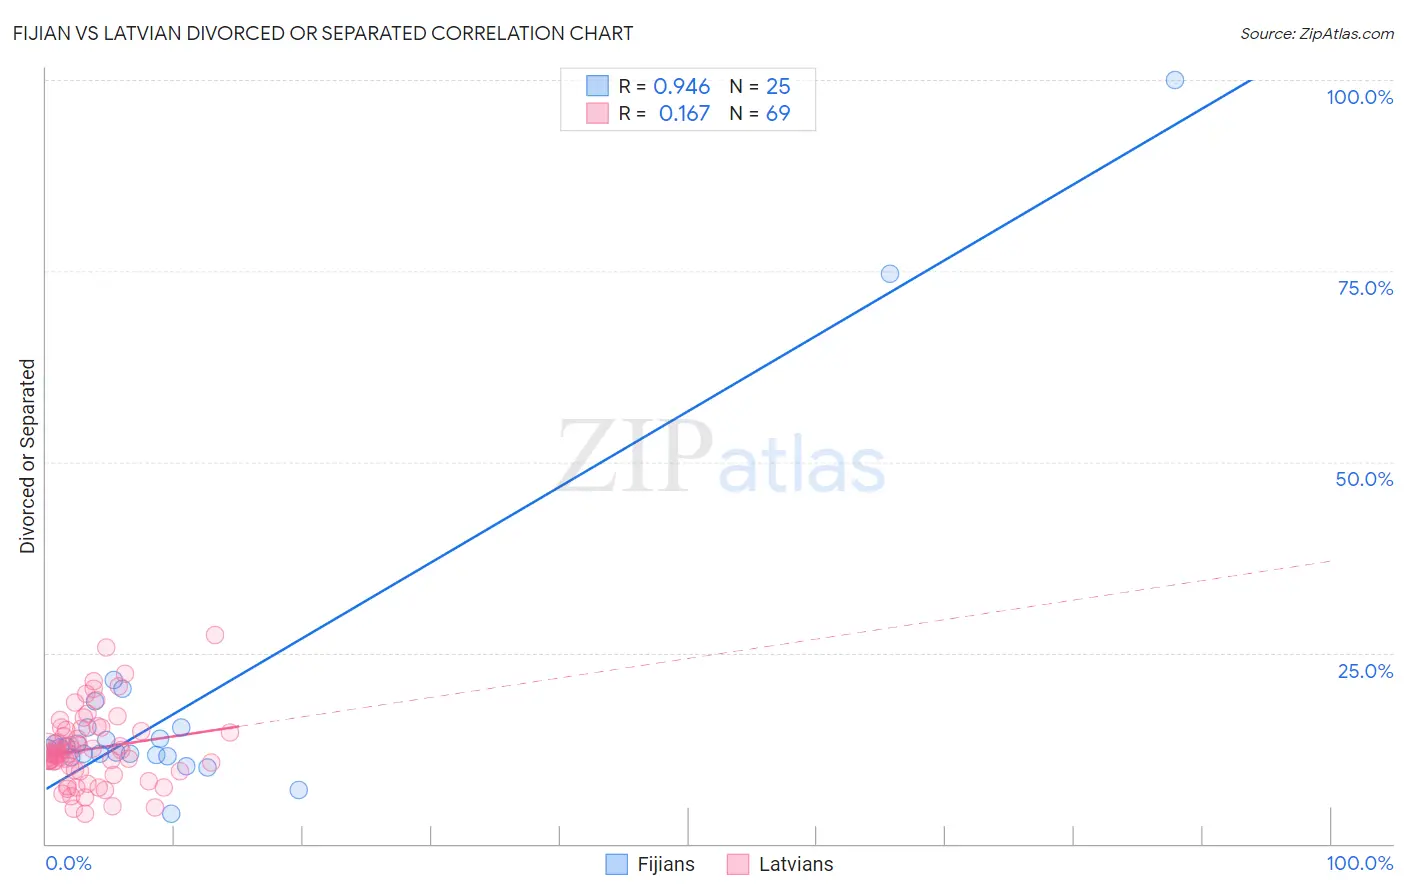
Fijian vs Latvian Divorced or Separated Correlation Chart
The statistical analysis conducted on geographies consisting of 55,948,408 people shows a near-perfect positive correlation between the proportion of Fijians and percentage of population currently divorced or separated in the United States with a correlation coefficient (R) of 0.946 and weighted average of 12.6%. Similarly, the statistical analysis conducted on geographies consisting of 220,642,308 people shows a poor positive correlation between the proportion of Latvians and percentage of population currently divorced or separated in the United States with a correlation coefficient (R) of 0.167 and weighted average of 11.6%, a difference of 8.8%.
Divorced or Separated Correlation Summary
| Measurement | Fijian | Latvian |
| Minimum | 4.0% | 4.0% |
| Maximum | 100.0% | 27.4% |
| Range | 96.0% | 23.4% |
| Mean | 18.8% | 12.4% |
| Median | 12.6% | 11.8% |
| Interquartile 25% (IQ1) | 11.6% | 9.5% |
| Interquartile 75% (IQ3) | 15.3% | 15.0% |
| Interquartile Range (IQR) | 3.7% | 5.5% |
| Standard Deviation (Sample) | 21.3% | 4.8% |
| Standard Deviation (Population) | 20.8% | 4.8% |
Similar Demographics by Divorced or Separated
Demographics Similar to Fijians by Divorced or Separated
In terms of divorced or separated, the demographic groups most similar to Fijians are Scottish (12.6%, a difference of 0.010%), Immigrants from Liberia (12.6%, a difference of 0.010%), White/Caucasian (12.6%, a difference of 0.060%), Immigrants from Senegal (12.6%, a difference of 0.070%), and English (12.6%, a difference of 0.080%).
| Demographics | Rating | Rank | Divorced or Separated |
| Immigrants | Dominica | 0.5 /100 | #261 | Tragic 12.6% |
| Basques | 0.5 /100 | #262 | Tragic 12.6% |
| Immigrants | Panama | 0.5 /100 | #263 | Tragic 12.6% |
| English | 0.5 /100 | #264 | Tragic 12.6% |
| Immigrants | Senegal | 0.5 /100 | #265 | Tragic 12.6% |
| Whites/Caucasians | 0.5 /100 | #266 | Tragic 12.6% |
| Scottish | 0.4 /100 | #267 | Tragic 12.6% |
| Fijians | 0.4 /100 | #268 | Tragic 12.6% |
| Immigrants | Liberia | 0.4 /100 | #269 | Tragic 12.6% |
| Ute | 0.4 /100 | #270 | Tragic 12.6% |
| Panamanians | 0.3 /100 | #271 | Tragic 12.7% |
| Immigrants | Middle Africa | 0.3 /100 | #272 | Tragic 12.7% |
| Immigrants | Micronesia | 0.3 /100 | #273 | Tragic 12.7% |
| Bermudans | 0.3 /100 | #274 | Tragic 12.7% |
| Central American Indians | 0.3 /100 | #275 | Tragic 12.7% |
Demographics Similar to Latvians by Divorced or Separated
In terms of divorced or separated, the demographic groups most similar to Latvians are Immigrants from Ukraine (11.6%, a difference of 0.030%), Immigrants from Jordan (11.6%, a difference of 0.040%), Immigrants from Serbia (11.6%, a difference of 0.050%), Immigrants from Sweden (11.6%, a difference of 0.060%), and Immigrants from Northern Europe (11.6%, a difference of 0.090%).
| Demographics | Rating | Rank | Divorced or Separated |
| Zimbabweans | 99.0 /100 | #90 | Exceptional 11.6% |
| Spanish American Indians | 99.0 /100 | #91 | Exceptional 11.6% |
| Immigrants | Denmark | 98.9 /100 | #92 | Exceptional 11.6% |
| Arabs | 98.9 /100 | #93 | Exceptional 11.6% |
| Immigrants | Fiji | 98.9 /100 | #94 | Exceptional 11.6% |
| Immigrants | Serbia | 98.8 /100 | #95 | Exceptional 11.6% |
| Immigrants | Ukraine | 98.7 /100 | #96 | Exceptional 11.6% |
| Latvians | 98.7 /100 | #97 | Exceptional 11.6% |
| Immigrants | Jordan | 98.6 /100 | #98 | Exceptional 11.6% |
| Immigrants | Sweden | 98.6 /100 | #99 | Exceptional 11.6% |
| Immigrants | Northern Europe | 98.6 /100 | #100 | Exceptional 11.6% |
| Immigrants | Guyana | 98.5 /100 | #101 | Exceptional 11.6% |
| Immigrants | Croatia | 98.3 /100 | #102 | Exceptional 11.6% |
| Maltese | 98.2 /100 | #103 | Exceptional 11.6% |
| Salvadorans | 98.2 /100 | #104 | Exceptional 11.6% |