Tlingit-Haida vs Guyanese Divorced or Separated
COMPARE
Tlingit-Haida
Guyanese
Divorced or Separated
Divorced or Separated Comparison
Tlingit-Haida
Guyanese
13.2%
DIVORCED OR SEPARATED
0.0/ 100
METRIC RATING
306th/ 347
METRIC RANK
11.5%
DIVORCED OR SEPARATED
99.4/ 100
METRIC RATING
79th/ 347
METRIC RANK
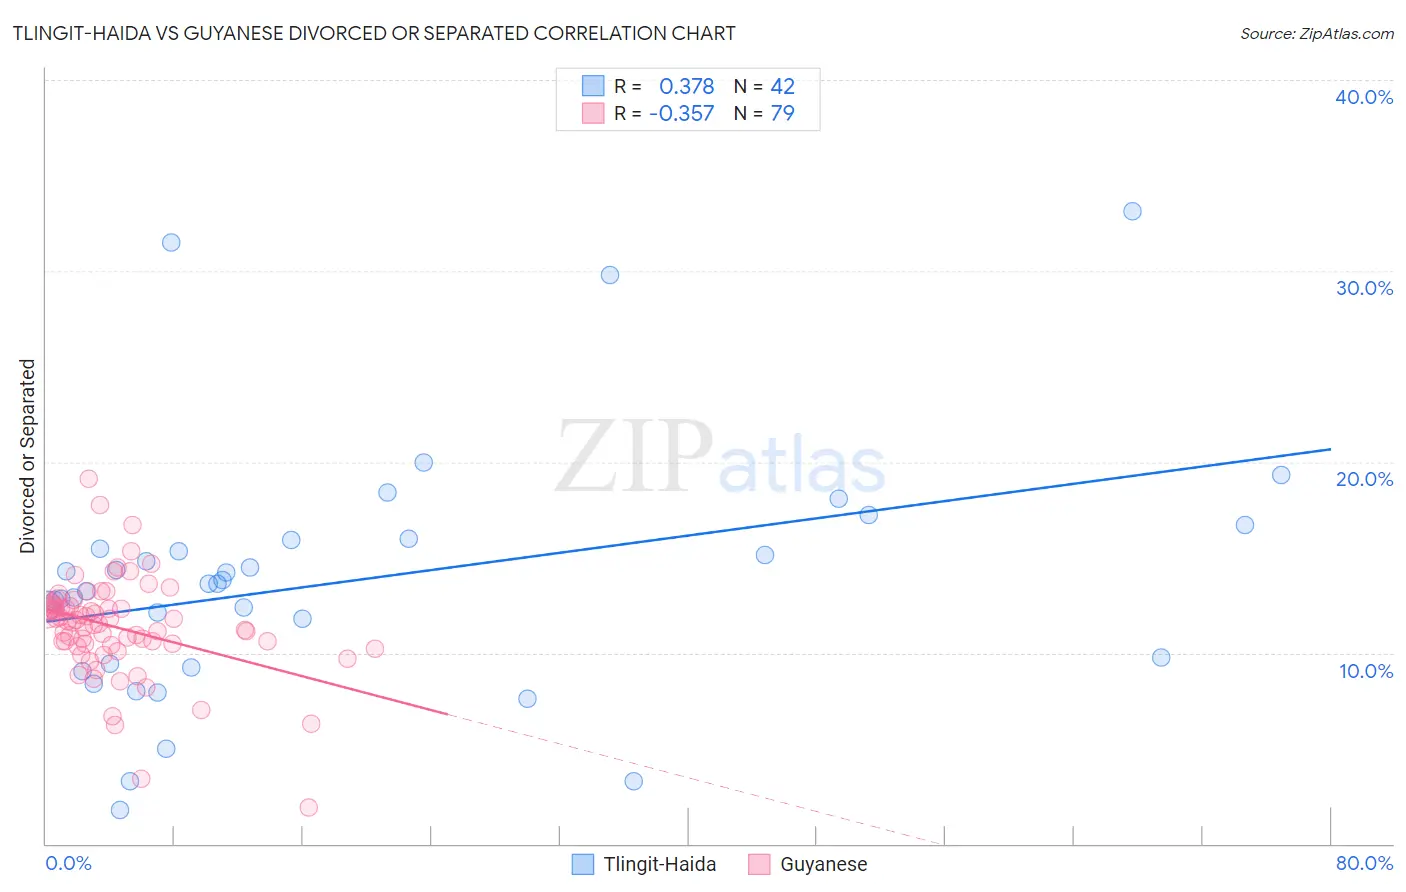
Tlingit-Haida vs Guyanese Divorced or Separated Correlation Chart
The statistical analysis conducted on geographies consisting of 60,872,098 people shows a mild positive correlation between the proportion of Tlingit-Haida and percentage of population currently divorced or separated in the United States with a correlation coefficient (R) of 0.378 and weighted average of 13.2%. Similarly, the statistical analysis conducted on geographies consisting of 176,825,728 people shows a mild negative correlation between the proportion of Guyanese and percentage of population currently divorced or separated in the United States with a correlation coefficient (R) of -0.357 and weighted average of 11.5%, a difference of 14.5%.
Divorced or Separated Correlation Summary
| Measurement | Tlingit-Haida | Guyanese |
| Minimum | 1.8% | 1.9% |
| Maximum | 33.1% | 19.1% |
| Range | 31.3% | 17.2% |
| Mean | 13.8% | 11.3% |
| Median | 13.6% | 11.6% |
| Interquartile 25% (IQ1) | 9.4% | 10.4% |
| Interquartile 75% (IQ3) | 15.9% | 12.5% |
| Interquartile Range (IQR) | 6.5% | 2.1% |
| Standard Deviation (Sample) | 6.6% | 2.6% |
| Standard Deviation (Population) | 6.5% | 2.6% |
Similar Demographics by Divorced or Separated
Demographics Similar to Tlingit-Haida by Divorced or Separated
In terms of divorced or separated, the demographic groups most similar to Tlingit-Haida are Chippewa (13.2%, a difference of 0.16%), Hopi (13.2%, a difference of 0.22%), French American Indian (13.2%, a difference of 0.25%), Ottawa (13.2%, a difference of 0.34%), and Cape Verdean (13.1%, a difference of 0.35%).
| Demographics | Rating | Rank | Divorced or Separated |
| Immigrants | Jamaica | 0.0 /100 | #299 | Tragic 13.0% |
| Immigrants | Cabo Verde | 0.0 /100 | #300 | Tragic 13.1% |
| Alaskan Athabascans | 0.0 /100 | #301 | Tragic 13.1% |
| Immigrants | Venezuela | 0.0 /100 | #302 | Tragic 13.1% |
| Cape Verdeans | 0.0 /100 | #303 | Tragic 13.1% |
| Hopi | 0.0 /100 | #304 | Tragic 13.2% |
| Chippewa | 0.0 /100 | #305 | Tragic 13.2% |
| Tlingit-Haida | 0.0 /100 | #306 | Tragic 13.2% |
| French American Indians | 0.0 /100 | #307 | Tragic 13.2% |
| Ottawa | 0.0 /100 | #308 | Tragic 13.2% |
| Americans | 0.0 /100 | #309 | Tragic 13.2% |
| Africans | 0.0 /100 | #310 | Tragic 13.2% |
| Sioux | 0.0 /100 | #311 | Tragic 13.2% |
| Blackfeet | 0.0 /100 | #312 | Tragic 13.3% |
| Immigrants | Nicaragua | 0.0 /100 | #313 | Tragic 13.3% |
Demographics Similar to Guyanese by Divorced or Separated
In terms of divorced or separated, the demographic groups most similar to Guyanese are Immigrants from Switzerland (11.5%, a difference of 0.020%), Russian (11.5%, a difference of 0.030%), Afghan (11.5%, a difference of 0.040%), Immigrants from Romania (11.5%, a difference of 0.11%), and Immigrants from Italy (11.5%, a difference of 0.14%).
| Demographics | Rating | Rank | Divorced or Separated |
| Jordanians | 99.6 /100 | #72 | Exceptional 11.5% |
| Immigrants | North Macedonia | 99.6 /100 | #73 | Exceptional 11.5% |
| Taiwanese | 99.6 /100 | #74 | Exceptional 11.5% |
| Immigrants | Northern Africa | 99.6 /100 | #75 | Exceptional 11.5% |
| Albanians | 99.6 /100 | #76 | Exceptional 11.5% |
| Immigrants | Italy | 99.5 /100 | #77 | Exceptional 11.5% |
| Afghans | 99.4 /100 | #78 | Exceptional 11.5% |
| Guyanese | 99.4 /100 | #79 | Exceptional 11.5% |
| Immigrants | Switzerland | 99.4 /100 | #80 | Exceptional 11.5% |
| Russians | 99.4 /100 | #81 | Exceptional 11.5% |
| Immigrants | Romania | 99.3 /100 | #82 | Exceptional 11.5% |
| Immigrants | Bulgaria | 99.3 /100 | #83 | Exceptional 11.5% |
| Bulgarians | 99.3 /100 | #84 | Exceptional 11.5% |
| Immigrants | Albania | 99.3 /100 | #85 | Exceptional 11.5% |
| Immigrants | Latvia | 99.2 /100 | #86 | Exceptional 11.6% |