Shoshone vs Immigrants from Turkey Average Family Size
COMPARE
Shoshone
Immigrants from Turkey
Average Family Size
Average Family Size Comparison
Shoshone
Immigrants from Turkey
3.37
AVERAGE FAMILY SIZE
100.0/ 100
METRIC RATING
45th/ 347
METRIC RANK
3.18
AVERAGE FAMILY SIZE
4.2/ 100
METRIC RATING
235th/ 347
METRIC RANK
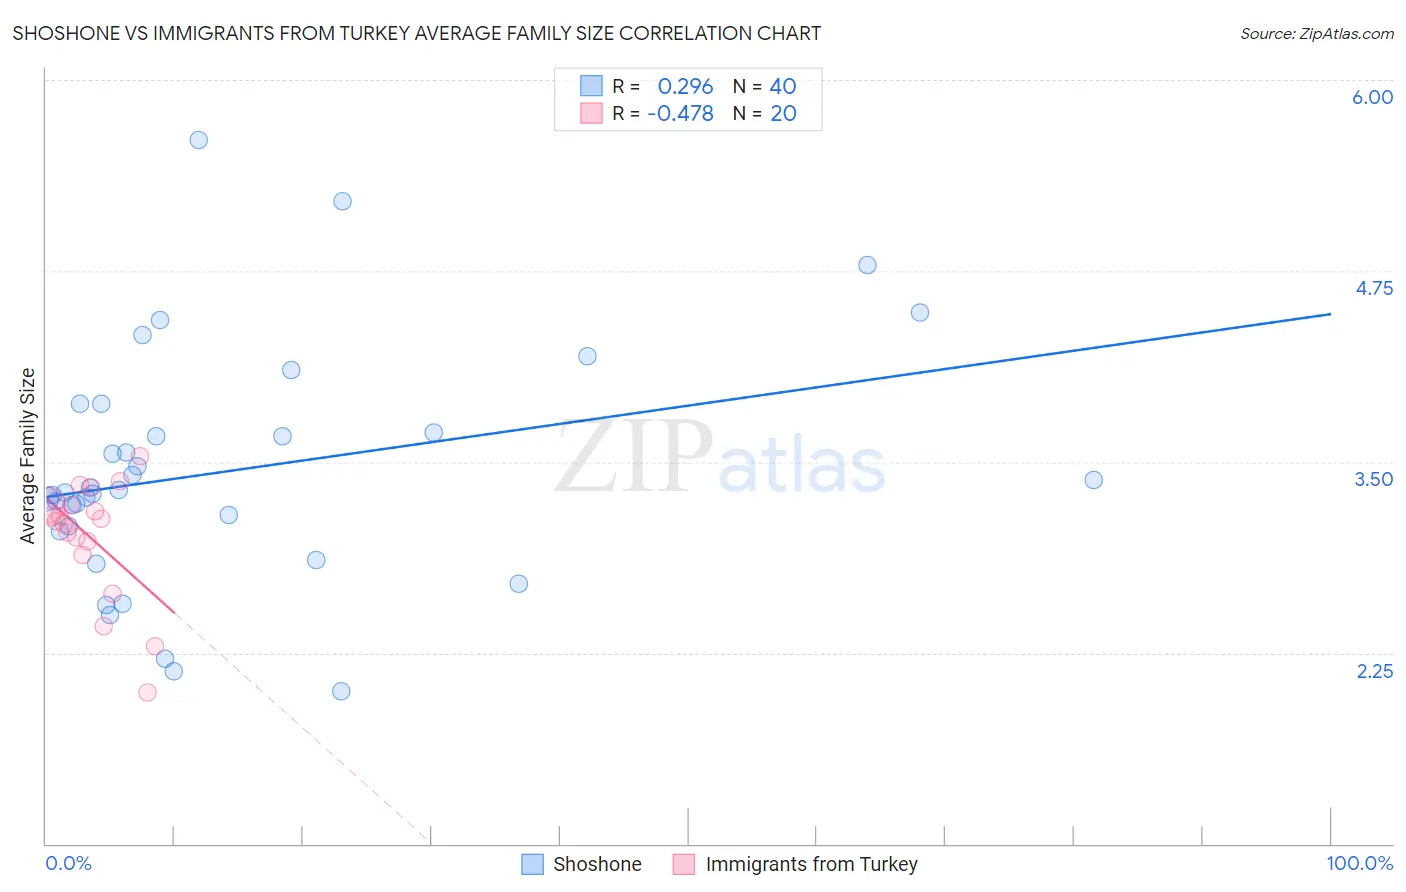
Shoshone vs Immigrants from Turkey Average Family Size Correlation Chart
The statistical analysis conducted on geographies consisting of 66,616,007 people shows a weak positive correlation between the proportion of Shoshone and average family size in the United States with a correlation coefficient (R) of 0.296 and weighted average of 3.37. Similarly, the statistical analysis conducted on geographies consisting of 222,976,596 people shows a moderate negative correlation between the proportion of Immigrants from Turkey and average family size in the United States with a correlation coefficient (R) of -0.478 and weighted average of 3.18, a difference of 6.0%.
Average Family Size Correlation Summary
| Measurement | Shoshone | Immigrants from Turkey |
| Minimum | 2.00 | 1.99 |
| Maximum | 5.61 | 3.54 |
| Range | 3.61 | 1.55 |
| Mean | 3.44 | 3.00 |
| Median | 3.31 | 3.12 |
| Interquartile 25% (IQ1) | 3.06 | 2.93 |
| Interquartile 75% (IQ3) | 3.79 | 3.22 |
| Interquartile Range (IQR) | 0.72 | 0.28 |
| Standard Deviation (Sample) | 0.78 | 0.39 |
| Standard Deviation (Population) | 0.77 | 0.38 |
Similar Demographics by Average Family Size
Demographics Similar to Shoshone by Average Family Size
In terms of average family size, the demographic groups most similar to Shoshone are Alaska Native (3.37, a difference of 0.030%), Immigrants from Philippines (3.37, a difference of 0.040%), Haitian (3.37, a difference of 0.060%), Vietnamese (3.37, a difference of 0.10%), and Immigrants from Nicaragua (3.37, a difference of 0.10%).
| Demographics | Rating | Rank | Average Family Size |
| Immigrants | Belize | 100.0 /100 | #38 | Exceptional 3.39 |
| Immigrants | Haiti | 100.0 /100 | #39 | Exceptional 3.39 |
| Belizeans | 100.0 /100 | #40 | Exceptional 3.39 |
| Marshallese | 100.0 /100 | #41 | Exceptional 3.38 |
| Immigrants | Vietnam | 100.0 /100 | #42 | Exceptional 3.38 |
| Immigrants | Philippines | 100.0 /100 | #43 | Exceptional 3.37 |
| Alaska Natives | 100.0 /100 | #44 | Exceptional 3.37 |
| Shoshone | 100.0 /100 | #45 | Exceptional 3.37 |
| Haitians | 100.0 /100 | #46 | Exceptional 3.37 |
| Vietnamese | 100.0 /100 | #47 | Exceptional 3.37 |
| Immigrants | Nicaragua | 100.0 /100 | #48 | Exceptional 3.37 |
| Bangladeshis | 100.0 /100 | #49 | Exceptional 3.37 |
| Immigrants | Bangladesh | 100.0 /100 | #50 | Exceptional 3.36 |
| Nicaraguans | 100.0 /100 | #51 | Exceptional 3.36 |
| Fijians | 100.0 /100 | #52 | Exceptional 3.36 |
Demographics Similar to Immigrants from Turkey by Average Family Size
In terms of average family size, the demographic groups most similar to Immigrants from Turkey are Immigrants from Portugal (3.18, a difference of 0.010%), Iranian (3.18, a difference of 0.020%), Brazilian (3.18, a difference of 0.030%), Cherokee (3.18, a difference of 0.050%), and Immigrants from Romania (3.18, a difference of 0.060%).
| Demographics | Rating | Rank | Average Family Size |
| Immigrants | Nonimmigrants | 5.7 /100 | #228 | Tragic 3.19 |
| Immigrants | Italy | 5.3 /100 | #229 | Tragic 3.19 |
| Icelanders | 5.2 /100 | #230 | Tragic 3.19 |
| Basques | 5.2 /100 | #231 | Tragic 3.19 |
| Cherokee | 4.7 /100 | #232 | Tragic 3.18 |
| Brazilians | 4.5 /100 | #233 | Tragic 3.18 |
| Iranians | 4.5 /100 | #234 | Tragic 3.18 |
| Immigrants | Turkey | 4.2 /100 | #235 | Tragic 3.18 |
| Immigrants | Portugal | 4.2 /100 | #236 | Tragic 3.18 |
| Immigrants | Romania | 3.7 /100 | #237 | Tragic 3.18 |
| Romanians | 3.7 /100 | #238 | Tragic 3.18 |
| Houma | 3.4 /100 | #239 | Tragic 3.18 |
| Osage | 3.2 /100 | #240 | Tragic 3.18 |
| Immigrants | Japan | 3.0 /100 | #241 | Tragic 3.18 |
| Hungarians | 3.0 /100 | #242 | Tragic 3.18 |