Ute vs Immigrants from Turkey Average Family Size
COMPARE
Ute
Immigrants from Turkey
Average Family Size
Average Family Size Comparison
Ute
Immigrants from Turkey
3.49
AVERAGE FAMILY SIZE
100.0/ 100
METRIC RATING
16th/ 347
METRIC RANK
3.18
AVERAGE FAMILY SIZE
4.2/ 100
METRIC RATING
235th/ 347
METRIC RANK
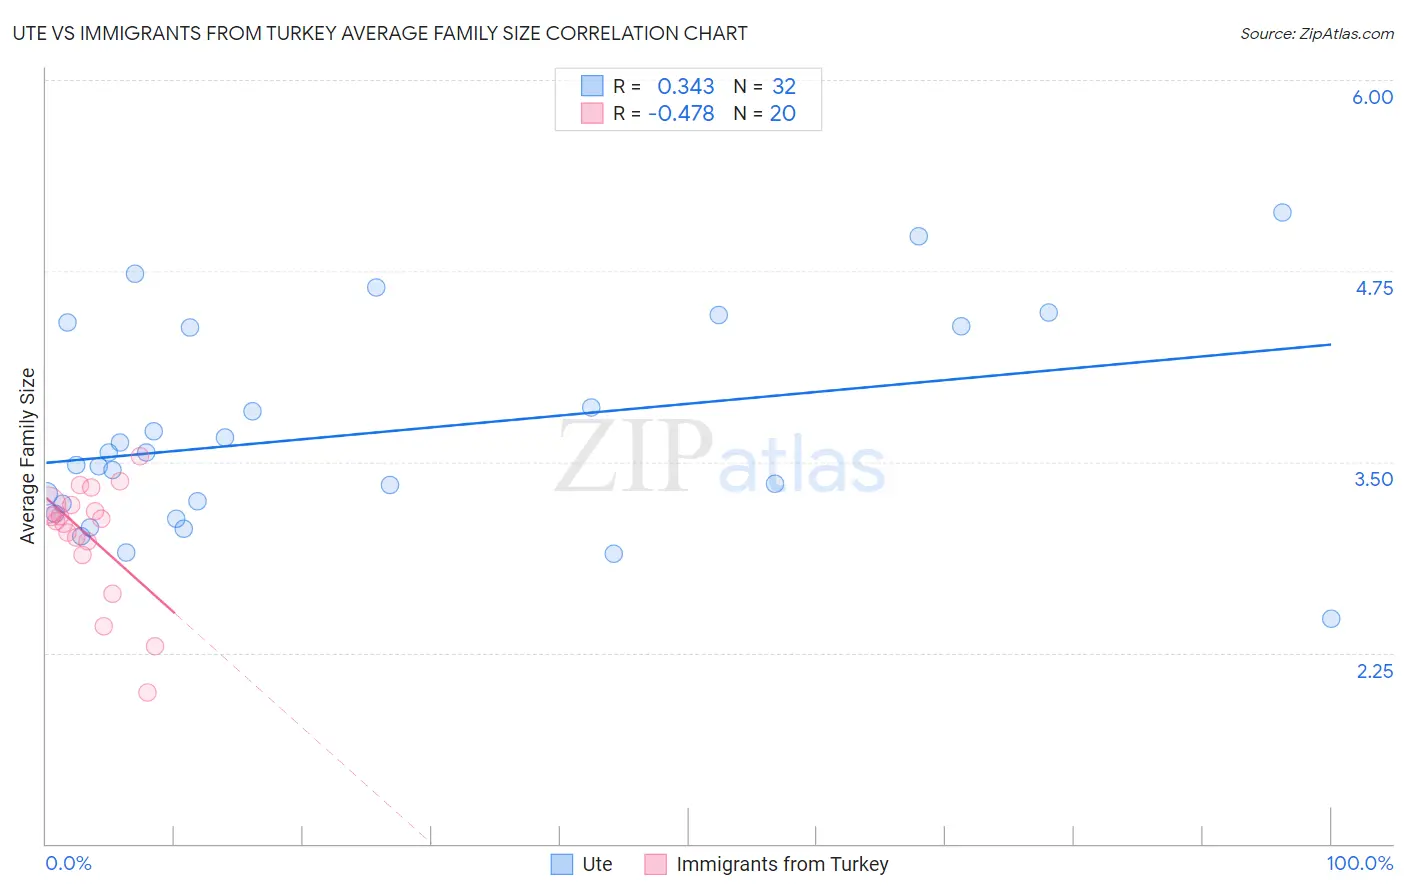
Ute vs Immigrants from Turkey Average Family Size Correlation Chart
The statistical analysis conducted on geographies consisting of 55,658,636 people shows a mild positive correlation between the proportion of Ute and average family size in the United States with a correlation coefficient (R) of 0.343 and weighted average of 3.49. Similarly, the statistical analysis conducted on geographies consisting of 222,976,596 people shows a moderate negative correlation between the proportion of Immigrants from Turkey and average family size in the United States with a correlation coefficient (R) of -0.478 and weighted average of 3.18, a difference of 9.7%.
Average Family Size Correlation Summary
| Measurement | Ute | Immigrants from Turkey |
| Minimum | 2.47 | 1.99 |
| Maximum | 5.13 | 3.54 |
| Range | 2.66 | 1.55 |
| Mean | 3.69 | 3.00 |
| Median | 3.52 | 3.12 |
| Interquartile 25% (IQ1) | 3.19 | 2.93 |
| Interquartile 75% (IQ3) | 4.38 | 3.22 |
| Interquartile Range (IQR) | 1.19 | 0.28 |
| Standard Deviation (Sample) | 0.67 | 0.39 |
| Standard Deviation (Population) | 0.66 | 0.38 |
Similar Demographics by Average Family Size
Demographics Similar to Ute by Average Family Size
In terms of average family size, the demographic groups most similar to Ute are Tongan (3.49, a difference of 0.060%), Immigrants from El Salvador (3.49, a difference of 0.090%), Immigrants from Central America (3.49, a difference of 0.11%), Salvadoran (3.48, a difference of 0.34%), and Mexican (3.48, a difference of 0.40%).
| Demographics | Rating | Rank | Average Family Size |
| Hopi | 100.0 /100 | #9 | Exceptional 3.60 |
| Spanish American Indians | 100.0 /100 | #10 | Exceptional 3.58 |
| Tohono O'odham | 100.0 /100 | #11 | Exceptional 3.53 |
| Immigrants | Mexico | 100.0 /100 | #12 | Exceptional 3.52 |
| Sioux | 100.0 /100 | #13 | Exceptional 3.52 |
| Immigrants | Central America | 100.0 /100 | #14 | Exceptional 3.49 |
| Tongans | 100.0 /100 | #15 | Exceptional 3.49 |
| Ute | 100.0 /100 | #16 | Exceptional 3.49 |
| Immigrants | El Salvador | 100.0 /100 | #17 | Exceptional 3.49 |
| Salvadorans | 100.0 /100 | #18 | Exceptional 3.48 |
| Mexicans | 100.0 /100 | #19 | Exceptional 3.48 |
| Cheyenne | 100.0 /100 | #20 | Exceptional 3.47 |
| Yuman | 100.0 /100 | #21 | Exceptional 3.47 |
| Apache | 100.0 /100 | #22 | Exceptional 3.46 |
| Immigrants | Fiji | 100.0 /100 | #23 | Exceptional 3.45 |
Demographics Similar to Immigrants from Turkey by Average Family Size
In terms of average family size, the demographic groups most similar to Immigrants from Turkey are Immigrants from Portugal (3.18, a difference of 0.010%), Iranian (3.18, a difference of 0.020%), Brazilian (3.18, a difference of 0.030%), Cherokee (3.18, a difference of 0.050%), and Immigrants from Romania (3.18, a difference of 0.060%).
| Demographics | Rating | Rank | Average Family Size |
| Immigrants | Nonimmigrants | 5.7 /100 | #228 | Tragic 3.19 |
| Immigrants | Italy | 5.3 /100 | #229 | Tragic 3.19 |
| Icelanders | 5.2 /100 | #230 | Tragic 3.19 |
| Basques | 5.2 /100 | #231 | Tragic 3.19 |
| Cherokee | 4.7 /100 | #232 | Tragic 3.18 |
| Brazilians | 4.5 /100 | #233 | Tragic 3.18 |
| Iranians | 4.5 /100 | #234 | Tragic 3.18 |
| Immigrants | Turkey | 4.2 /100 | #235 | Tragic 3.18 |
| Immigrants | Portugal | 4.2 /100 | #236 | Tragic 3.18 |
| Immigrants | Romania | 3.7 /100 | #237 | Tragic 3.18 |
| Romanians | 3.7 /100 | #238 | Tragic 3.18 |
| Houma | 3.4 /100 | #239 | Tragic 3.18 |
| Osage | 3.2 /100 | #240 | Tragic 3.18 |
| Immigrants | Japan | 3.0 /100 | #241 | Tragic 3.18 |
| Hungarians | 3.0 /100 | #242 | Tragic 3.18 |