Iraqi vs Immigrants from Turkey Average Family Size
COMPARE
Iraqi
Immigrants from Turkey
Average Family Size
Average Family Size Comparison
Iraqis
Immigrants from Turkey
3.24
AVERAGE FAMILY SIZE
64.3/ 100
METRIC RATING
158th/ 347
METRIC RANK
3.18
AVERAGE FAMILY SIZE
4.2/ 100
METRIC RATING
235th/ 347
METRIC RANK
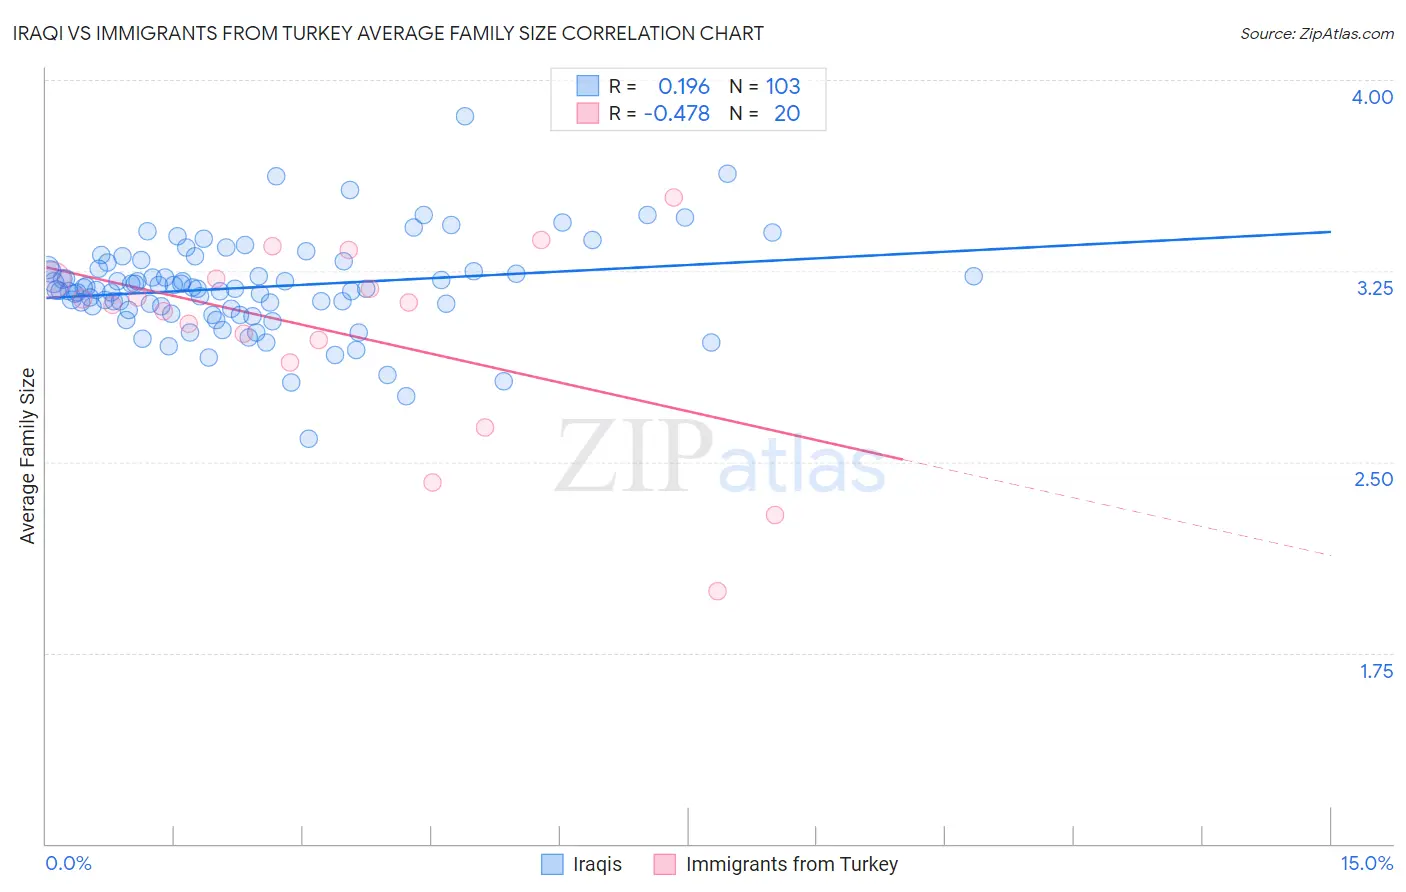
Iraqi vs Immigrants from Turkey Average Family Size Correlation Chart
The statistical analysis conducted on geographies consisting of 170,567,061 people shows a poor positive correlation between the proportion of Iraqis and average family size in the United States with a correlation coefficient (R) of 0.196 and weighted average of 3.24. Similarly, the statistical analysis conducted on geographies consisting of 222,976,596 people shows a moderate negative correlation between the proportion of Immigrants from Turkey and average family size in the United States with a correlation coefficient (R) of -0.478 and weighted average of 3.18, a difference of 1.7%.
Average Family Size Correlation Summary
| Measurement | Iraqi | Immigrants from Turkey |
| Minimum | 2.59 | 1.99 |
| Maximum | 3.86 | 3.54 |
| Range | 1.27 | 1.55 |
| Mean | 3.19 | 3.00 |
| Median | 3.18 | 3.12 |
| Interquartile 25% (IQ1) | 3.10 | 2.93 |
| Interquartile 75% (IQ3) | 3.26 | 3.22 |
| Interquartile Range (IQR) | 0.16 | 0.28 |
| Standard Deviation (Sample) | 0.18 | 0.39 |
| Standard Deviation (Population) | 0.18 | 0.38 |
Similar Demographics by Average Family Size
Demographics Similar to Iraqis by Average Family Size
In terms of average family size, the demographic groups most similar to Iraqis are Ethiopian (3.24, a difference of 0.010%), Immigrants from Iraq (3.24, a difference of 0.010%), Immigrants from Chile (3.24, a difference of 0.020%), Immigrants from Uzbekistan (3.24, a difference of 0.050%), and Seminole (3.24, a difference of 0.080%).
| Demographics | Rating | Rank | Average Family Size |
| Jordanians | 73.5 /100 | #151 | Good 3.24 |
| Spanish Americans | 72.5 /100 | #152 | Good 3.24 |
| Immigrants | Eritrea | 71.4 /100 | #153 | Good 3.24 |
| Immigrants | Egypt | 70.0 /100 | #154 | Good 3.24 |
| Seminole | 68.2 /100 | #155 | Good 3.24 |
| Immigrants | Taiwan | 68.1 /100 | #156 | Good 3.24 |
| Immigrants | Uzbekistan | 67.0 /100 | #157 | Good 3.24 |
| Iraqis | 64.3 /100 | #158 | Good 3.24 |
| Ethiopians | 63.9 /100 | #159 | Good 3.24 |
| Immigrants | Iraq | 63.7 /100 | #160 | Good 3.24 |
| Immigrants | Chile | 63.2 /100 | #161 | Good 3.24 |
| Immigrants | Uganda | 60.1 /100 | #162 | Good 3.23 |
| Uruguayans | 58.8 /100 | #163 | Average 3.23 |
| Egyptians | 58.6 /100 | #164 | Average 3.23 |
| Ugandans | 58.4 /100 | #165 | Average 3.23 |
Demographics Similar to Immigrants from Turkey by Average Family Size
In terms of average family size, the demographic groups most similar to Immigrants from Turkey are Immigrants from Portugal (3.18, a difference of 0.010%), Iranian (3.18, a difference of 0.020%), Brazilian (3.18, a difference of 0.030%), Cherokee (3.18, a difference of 0.050%), and Immigrants from Romania (3.18, a difference of 0.060%).
| Demographics | Rating | Rank | Average Family Size |
| Immigrants | Nonimmigrants | 5.7 /100 | #228 | Tragic 3.19 |
| Immigrants | Italy | 5.3 /100 | #229 | Tragic 3.19 |
| Icelanders | 5.2 /100 | #230 | Tragic 3.19 |
| Basques | 5.2 /100 | #231 | Tragic 3.19 |
| Cherokee | 4.7 /100 | #232 | Tragic 3.18 |
| Brazilians | 4.5 /100 | #233 | Tragic 3.18 |
| Iranians | 4.5 /100 | #234 | Tragic 3.18 |
| Immigrants | Turkey | 4.2 /100 | #235 | Tragic 3.18 |
| Immigrants | Portugal | 4.2 /100 | #236 | Tragic 3.18 |
| Immigrants | Romania | 3.7 /100 | #237 | Tragic 3.18 |
| Romanians | 3.7 /100 | #238 | Tragic 3.18 |
| Houma | 3.4 /100 | #239 | Tragic 3.18 |
| Osage | 3.2 /100 | #240 | Tragic 3.18 |
| Immigrants | Japan | 3.0 /100 | #241 | Tragic 3.18 |
| Hungarians | 3.0 /100 | #242 | Tragic 3.18 |